
HarvestGroup360
© 2026 HarvestGroup360 — a brand operated by AMII LTD.
The closing cross arrives on the tape with a timestamp, a price and a size, exactly like every other row. Nobody crossed a spread to produce it, and every statistic that treats it as an ordinary trade is wrong in the flattering direction.
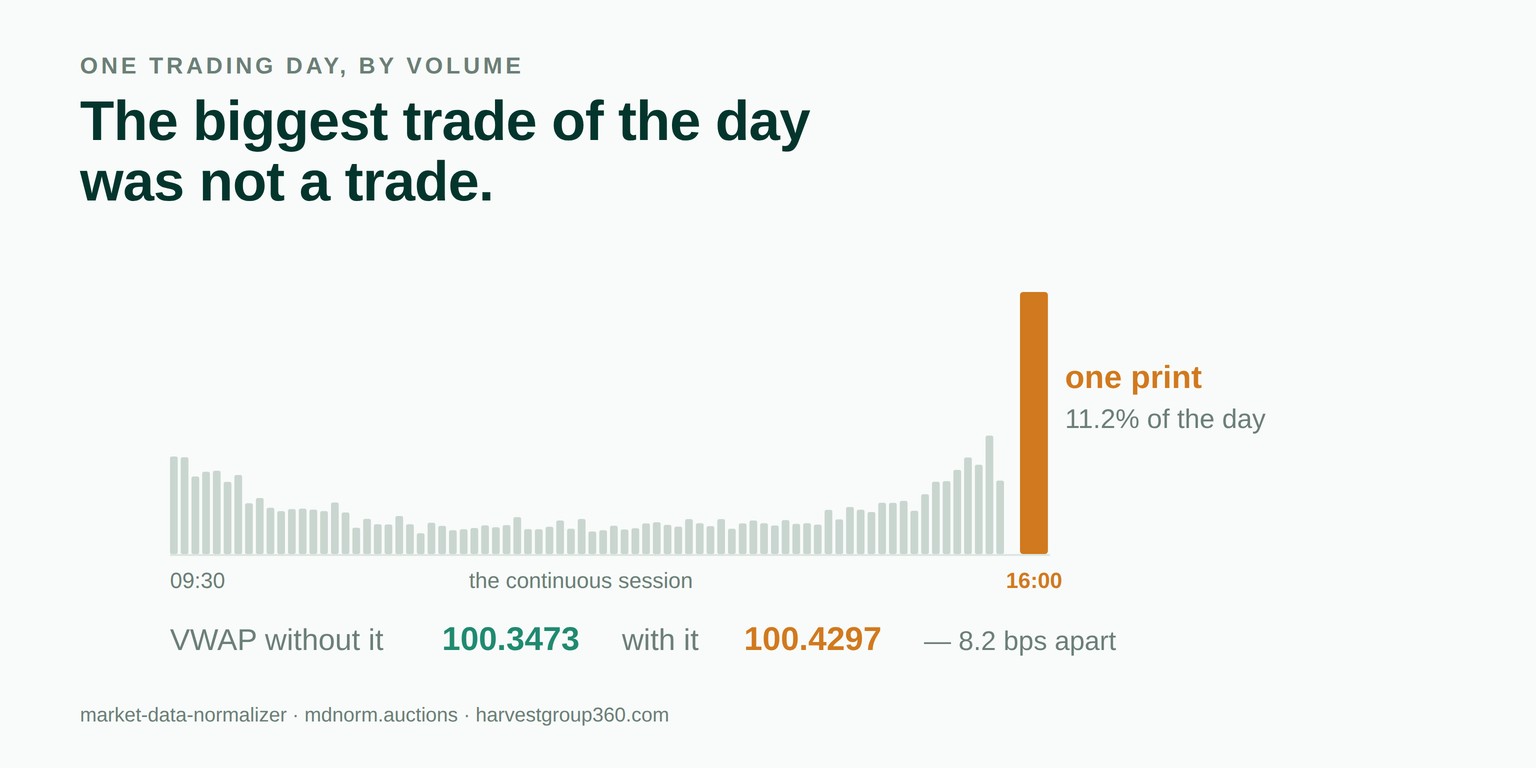
Yesterday we wrote about the difference between a thousand rows and two hundred observations. That was a question of how many pieces of evidence a dataset holds. This one is smaller and more concrete: two of the rows in a trading day are not trades, and no amount of careful statistics downstream will notice.
The day we use throughout this article is a single ordinary session: an opening cross, three hundred and eighty-nine minute prints through the continuous session, and a closing cross. Three hundred and ninety-one rows in total, of which two are auctions.
| Count | Share of volume | |
|---|---|---|
| continuous prints | 389 | 86.00% |
| opening cross | 1 | 2.80% |
| closing cross | 1 | 11.20% |
Nothing about that is unusual. Closing auctions have been growing as a share of equity volume for a decade, and on an index rebalance day the cross can be a multiple of this. The point is that a row count of 391 and a volume-weighted view of the same day disagree about what happened, and most pipelines only compute one of them.
The place this shows up in money is execution measurement. A VWAP computed over the full tape includes the closing cross at its full weight, and one print of that size moves the benchmark:
| Closing cross, as % of volume | Auction share of volume | VWAP gap |
|---|---|---|
| 2% | 4.80% | +0.67 bps |
| 5% | 7.80% | +3.13 bps |
| 8% | 10.80% | +5.59 bps |
| 11.2% | 14.00% | +8.21 bps |
| 20% | 22.80% | +15.43 bps |
| 30% | 32.80% | +23.63 bps |
On the base day the benchmark including the crosses is 100.4297 and the continuous benchmark is 100.3473. Eight and a fifth basis points is not a rounding difference in execution: it is larger than the commission on most equity flow and comparable to the spread on a liquid name.
The direction matters as much as the size. A desk that works an order through the day and never touches the auction is measured against a price it could not have obtained. A desk that puts the whole order in the closing cross beats the same benchmark by construction, having taken on a completely different risk. Neither number is a statement about skill.
Trade classification is the other place this bites, and it is worse because it fails silently. The tick rule and the quote rule both always return a side. Handed a closing cross, they return one too.
>>> tick_rule([e.price for e in day])[-1]
<Side.BUY>

# move the last continuous print 40 cents higher; the cross is untouched
>>> tick_rule([e.price for e in moved])[-1]
<Side.SELL>
The auction is identical in both runs — same price, same size, same timestamp. What changed is where the previous continuous print happened to sit. That is what the classification is measuring, and it will flow straight into any order-flow imbalance, any signed-volume feature and any toxicity measure built on top of it.
It is worth saying that neither rule is broken. Both are doing exactly what they claim: inferring direction from price changes. The failure is in handing them a row that was never produced by somebody taking a price.
Volatility built from tick returns has the same problem in a quieter form. The crosses print away from the last continuous quote, so each one contributes an outsized squared return:
| Tick-return standard deviation | Value | Observations |
|---|---|---|
| with the crosses | 0.00053052 | 390 |
| continuous only | 0.00050225 | 388 |
Five per cent is not dramatic on its own. It becomes so when the number is an input to a position sizer, a risk limit or a volatility-targeted allocation, all of which apply it every day, in the same direction, on every instrument in the book.
Everything above depends on knowing when the auctions were. The tempting implementation is a constant — the close is at 16:00, put the window there. It works until the venue closes early.
| Windows built from | Auction trades found | Volume in auctions | VWAP gap |
|---|---|---|---|
| the trading calendar | 2 | 14.00% | +5.00 bps |
| a 16:00 close, assumed | 1 | 2.80% | −2.38 bps |
The second row is the dangerous one. It does not fail — it reports a plausible 2.80 per cent and a small negative gap, and a reviewer looking at the output has no reason to doubt it. The cross worth a ninth of the day is in the continuous bucket, contaminating exactly the population that was supposed to be free of it.
So the windows are derived from a trading calendar rather than from a clock, which is the same argument this library has made about the number of sessions in a year and about the tick size on an instrument: a constant somebody else chose rescales your answer while leaving its shape intact.
There is an obvious feature we have declined to build. It would be easy to infer auctions — flag any print more than ten times the median size, or read the condition codes where a vendor supplies them, and call the result the auction population.
We do not, because on a busy day that threshold reclassifies ordinary block trades, and the statistic it produces is then a property of the threshold rather than of the market. A user who changes ten to fifteen gets a different closing-auction share for the same day and no warning that anything moved. Either the windows are supplied, or the report comes back saying it has no windows to work with.
$ mdnorm auctions --csv day.csv --calendar xnys-2026.csv \\
    --session 09:30-16:00 --tz America/New_York
days                 1
auction windows      2
trades               391
  in an auction      2
volume in auctions   14.00%
notional in auctions 14.07%
largest single print 11.20% of volume
note: the crosses take a larger share of notional than of volume,
which is what happens when they print away from the day's average.
VWAP with auctions   100.429700
VWAP without         100.347300
difference           +8.21 bps
The window extents default to zero rather than to thirty seconds, which is the constant most people would reach for. Thirty seconds is right on some venues in some decades, and where it is wrong it moves ordinary continuous prints into the auction bucket without saying so. --open-window, --close-window and --lead are there for anyone who knows their venue's behaviour and can state it.
One detail in the command is worth mentioning because it was a bug we wrote and then found. The shared session filter in this library is half-open, as every interval in it is, which means a print stamped exactly at the closing bell falls outside the session. That is the correct behaviour everywhere else and precisely wrong here, since that print is the one this command exists to find. The command now reads the whole file and lets the windows do the selecting.
Every figure above came from the auctions module of our open-source library, released in version 1.30.0. MIT licensed, no runtime dependencies, 1,276 tests, type-checked clean. The calendar it reads its windows from is the same one behind the sessions-in-a-year piece.
pip install market-data-normalizerThe source is on GitHub, the package on PyPI, and the reasoning behind what the library will and will not do is in ROADMAP.md beside the code. Longer write-ups are on our Medium, releases on LinkedIn, and the tooling we run against our own data is in the Console.
The rest of the series is in our blog: a thousand rows and two hundred observations, what AI changed and what it multiplied, a volume profile fitted on the rest of the year, the delay between a venue stamp and an arrival and the things we have decided not to build. Public comments on the work are quoted in full with a link to each source on the community page, and the team is on the about page. Newer in the same series: twelve defensible pipelines and one published number.
We are open to everyone, from independent developers to funds. If something here is wrong, an issue with a concrete input and a statement of what the right answer would be is the most useful form to send it in — a failing test has always been worth more to us than a paragraph that is correct.
Because nobody crossed a spread to make it. An opening or closing cross aggregates orders that never met each other in a continuous book and settles them at one computed clearing price. It arrives on the tape looking like a trade — one timestamp, one price, one size — and it is the outcome of a different mechanism.
Enough to dominate anything volume-weighted. In the day used throughout this article, two prints out of three hundred and ninety-one carried 14.00 per cent of the volume, and the closing cross alone was 11.20 per cent of it. The exact share depends on the venue and the instrument, which is why the library measures it rather than assuming a figure.
It moves it toward a price that was available for one instant. On our day the VWAP including the crosses is 100.4297 and the VWAP of the continuous session is 100.3473 — 8.2 basis points apart. A strategy that never traded the auction is being scored against a price it could not have obtained, and one that only traded the auction beats the benchmark by construction.
It will always return something, and that is the problem. On our day the tick rule calls the closing cross a buy. Move the last continuous print forty cents higher and it calls the identical cross a sell. The side is a fact about where the previous print happened to sit, not about anything that took place in the auction.
Yes, and more than the print count suggests. Two prints out of three hundred and ninety-one raise the standard deviation of tick returns from 0.00050225 to 0.00053052, an overstatement of 5.6 per cent. The crosses print away from the last continuous quote, so each contributes an outsized squared return.
Because a half day closes early and a hardcoded time misses it. On a 13:00 close, windows built from the calendar find the cross and report 14.00 per cent of volume in auctions; windows that assume a 16:00 close find nothing there, report 2.80 per cent, and quietly leave a print worth a ninth of the day inside the continuous population.
Because a rule that reclassifies any print ten times the median size will catch ordinary block trades on a busy day, and the resulting statistic becomes a property of the threshold rather than of the market. Our implementation infers nothing: either the windows are supplied, or the report says it has no windows to work with.
No. The closing cross is the right price for marking a book, settling a derivative and computing an official close, and the wrong one for a spread estimate or an order-flow imbalance. Which of those you are doing is not something a library can infer, so ours splits the two populations and hands back both halves.