
HarvestGroup360
© 2026 HarvestGroup360 — a brand operated by AMII LTD.
Two rows of a five-day forward return, computed a day apart, share four of their five days. Every statistic that counts them as two pieces of evidence is counting the same week five times.
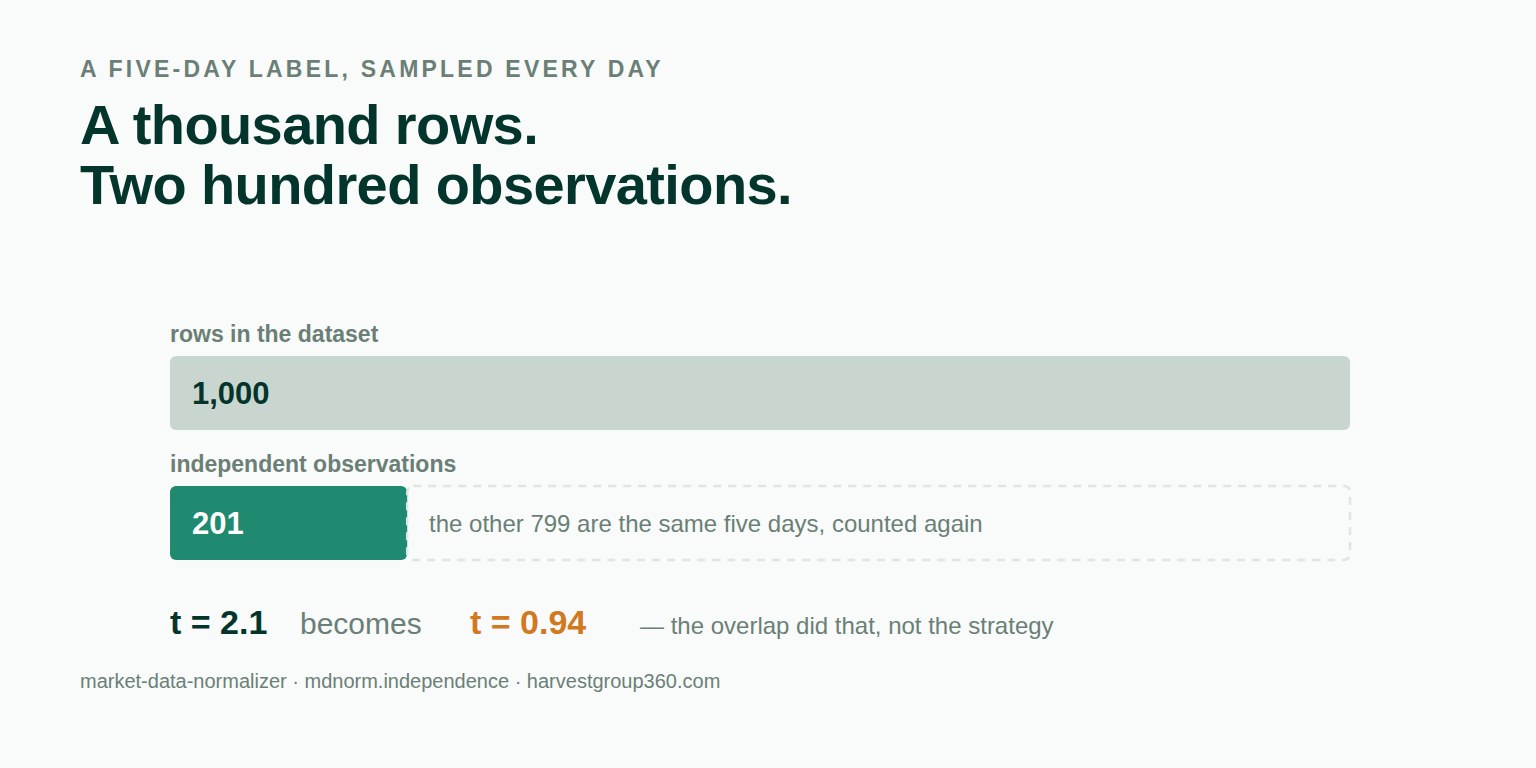
Yesterday we wrote about what artificial intelligence changed and what it only multiplied, and the argument there rested on the number of strategies a search evaluates. This is the same problem one level down, and it bites before any question of overfitting arises. It applies to a single strategy, tested once, by somebody with no search at all.
Take a thousand daily observations and label each one with the return over the following five days. That is the most ordinary thing in systematic research and it produces a thousand rows.
Monday's label covers Tuesday to Monday. Tuesday's covers Wednesday to Tuesday. Four of those five days are the same days. Sampled daily, every label in the interior of the sample overlaps the four before it and the four after it, so it is worth about a fifth of an independent observation — and the thousand rows carry a little over two hundred.
That is not an approximation. The labels state their own windows, so you can count exactly how many are live at every point in time and average the reciprocal over each label's span. On this input the answer is 200.8.
| Label horizon | Effective of 1,000 | Inflation | A t of 2.1 becomes |
|---|---|---|---|
| 1 day (no overlap) | 1,000.0 | 1.00× | 2.100 |
| 2 days | 500.5 | 1.41× | 1.486 |
| 5 days | 200.8 | 2.23× | 0.941 |
| 10 days | 100.9 | 3.15× | 0.667 |
| 1 month (21 days) | 48.6 | 4.54× | 0.463 |
| 1 quarter (63 days) | 16.9 | 7.70× | 0.273 |
The five-day row is the one to sit with. A t-statistic of 2.1 is the number that gets a strategy into production and a paper into a journal. Corrected for the overlap it is 0.94, which is the number you would expect from a coin. Nothing about the strategy changed between those two figures.
The quarterly row is worse than it looks. A thousand daily observations of a quarterly label carry seventeen independent pieces of information — roughly four years of quarters, which is exactly what they are. The thousand rows were never a thousand anything.
The obvious response is that sampling less often would throw away data, and it is worth checking whether that is true. It is mostly not:
| Sampling | Rows | Effective | Inflation |
|---|---|---|---|
| every day | 1,000 | 200.8 | 2.23× |
| every 2nd day | 500 | 200.6 | 1.58× |
| every 3rd day | 333 | 200.2 | 1.29× |
| every 5th day | 200 | 200.0 | 1.00× |
Sampling every fifth day discards eight hundred rows and 0.8 of an observation. The information was not in those rows. What you gain is a sample whose size is the size it appears to be, which means every downstream statistic — the t-statistic, the confidence interval, the cross-validation score, the p-value — is computed on a count that is true.
There is a real trade-off, and it is worth stating rather than hiding: with fewer rows a model has fewer gradient steps to learn from, and for some estimators that matters even when the information content is unchanged. The point is not that daily sampling is forbidden. It is that the inference at the end must use the effective count, whatever the fitting used.
Anyone who has read the cross-validation literature will already be purging: removing training rows whose label windows reach into the test block, so a model is not trained on the same future it is scored on. Our own library has done that for a long time, and it is necessary.
It is also a different problem. Purging stops the overlap leaking across a split. Nothing in it stops the overlap inflating the sample within one. A pipeline can be correctly purged, correctly embargoed, and still report a t-statistic that is twice what the evidence supports.
We noticed this in our own library rather than in someone else's. The module that generates overlapping labels and the module that computes significance had been sitting beside each other for months with nothing between them.
Not every series has explicit windows. A stream of returns from a strategy that holds positions for an unstated length has dependence in it and no window to count. There the honest answer is an estimate from the sample autocorrelation, and it should be read as an order of magnitude rather than quoted.
One implementation detail matters more than it sounds. The sum of autocorrelations has to be truncated at the first non-positive lag. Continuing into the tail adds terms that are mostly noise, whose signs cancel arbitrarily, and a bad draw can produce an effective sample larger than the nominal one — which is the single outcome the whole exercise exists to rule out. Our implementation stops at the initial positive sequence and marks its answer as estimated, so it can never be mistaken for the exact figure.
On a first-order autoregressive series the estimate has a closed form to check against, and the test suite checks it at two values rather than asserting that the code does what the code does.
$ mdnorm independence --count 1000 --horizon 5 --t-stat 2.1
nominal sample       1000
effective sample     200.80  (exact)
ratio                20.1%
t-statistic inflated 2.232x
t-statistic given    2.1
t-statistic adjusted 0.941
note: that crosses the conventional two-sigma line in the wrong
direction. The overlap did it, not the strategy.
It also takes --spans for irregular windows — an event-driven label that ends on a signal rather than a clock — and --series with a stated truncation lag for the estimated route. There is no default lag and no default horizon, for the same reason this library ships no default number of sessions in a year and no default tick size: a constant chosen for you rescales the answer while leaving its shape intact, which is the hardest kind of error to notice.
Nothing is corrected silently. The report keeps both counts and prints the factor between them, because a statistic that has quietly been divided by something is harder to argue with than one that shows its working.
Every figure above came from the independence module of our open-source library, released in version 1.31.0. MIT licensed, no runtime dependencies, 1,237 tests, type-checked clean.
pip install market-data-normalizerThe source is on GitHub, the package on PyPI, and the reasoning behind what the library will and will not do is in ROADMAP.md beside the code. Longer write-ups are on our Medium, including Forty-Six on the search that produces a result from nothing, releases on LinkedIn, and the tooling we run against our own data is in the Console.
The rest of the series is in our blog: what AI changed and what it multiplied, a volume profile fitted on the rest of the year, the delay between a venue stamp and an arrival, the things we have decided not to build and a trading year that was not 252 sessions. Public comments on the work are quoted in full with a link to each source on the community page, and the team is on the about page. Newer in the same series: why forty positions is not forty bets, the Sharpe ratio of a residual, and the square root of twelve.
We are open to everyone, from independent developers to funds. If something here is wrong, an issue with a concrete input and a statement of what the right answer would be is the most useful form to send it in — a failing test has always been worth more to us than a paragraph that is correct.
The number of independent observations a dataset carries, as opposed to the number of rows in it. When rows describe overlapping stretches of the same history they are not separate pieces of evidence, and every statistic that divides by the row count is dividing by the wrong number.
A five-day forward return computed on Monday and again on Tuesday share four of their five days. They are two rows describing largely the same future. Sampled daily, each label overlaps the four before it and the four after it, so each is worth roughly a fifth of an independent observation.
By roughly the square root of the overlap. A five-day label sampled daily inflates by about 2.23, a monthly label by 4.54 and a quarterly one by 7.70. In practice that turns a t-statistic of 2.1 — which most people would call significant — into 0.94, which nobody would.
No, and they solve different halves of one problem. Purging removes the training rows whose label windows reach into a test block, so the overlap does not leak across the split. It does nothing about the overlap inflating the sample within a single block, which is what this measures. A pipeline can be correctly purged and still be reporting a t-statistic that is twice what it should be.
For labels, yes. The windows are known, so counting how many are live at each point in time and averaging the reciprocal over each label's own window gives the answer with no model and no assumption behind it. It is arithmetic rather than estimation.
Then there is no exact answer, only an estimate from the sample autocorrelation, which is itself noisy. It should be read as an order of magnitude. The sum of autocorrelations must also be truncated at the first non-positive lag, because continuing into the noise adds terms whose signs cancel arbitrarily and can report an effective sample larger than the real one.
Often yes, and it costs less than it appears. Sampling a five-day label every fifth day instead of every day reduces a thousand rows to two hundred and reduces the effective count from 200.8 to 200.0. You lose eight hundred rows and essentially no information, and the inflation factor falls from 2.23 to 1.00. The rows were never carrying anything.
Anywhere labels overlap in time. Rolling-window features in epidemiology, sensor data with overlapping aggregation windows, any panel where an outcome is measured over a period longer than the sampling interval. Finance is only unusual in how strongly it rewards the resulting overconfidence.