
HarvestGroup360
© 2026 HarvestGroup360 — a brand operated by AMII LTD.
Somebody hands you a CSV of prices. Are those trades that happened, or numbers computed from trades that happened? There is a one-pass test, and almost nobody runs it.
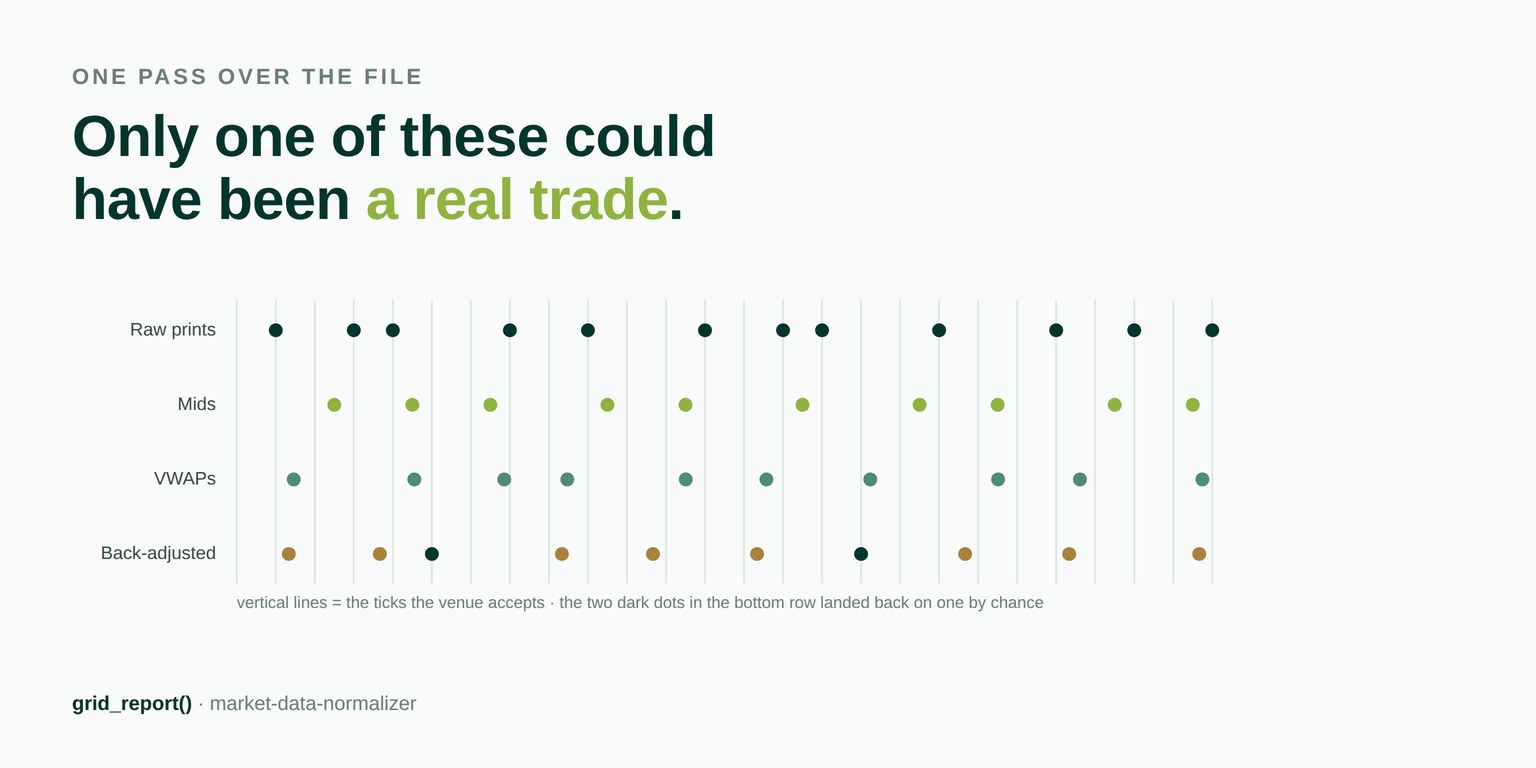
A venue does not accept an arbitrary price. It accepts multiples of a tick. That is not a convention or a rounding habit — an order at a price off the grid is rejected by the matching engine, so a trade at such a price never happened.
Which means raw prints sit on the tick grid by construction, and the converse is a free diagnostic that costs one pass over the file.
If a price series does not sit on the grid, it is not prints. It is one of a short list: a mid, a VWAP or other average, a consolidation across venues with different grids, a history back-adjusted for corporate actions, or an error. Those five look identical in a spreadsheet and behave very differently downstream.
| What the file is | On the grid | Verdict |
|---|---|---|
| Raw prints from one venue | 4 of 4 | could be real |
| Mids of a one-tick market | 0 of 2 | derived |
| VWAPs | 0 of 2 | derived |
| The same prints after a 3:1 adjustment | 2 of 4 | derived |
Back-adjustment is the case most people want to detect, and the answer depends entirely on the factor. We took every cent price from $10.00 to $500.00 — forty-nine thousand of them — divided by a range of realistic factors, and counted how many landed back on the cent grid:
| Adjustment factor | Still on the grid |
|---|---|
| 2:1 split | 50.00% |
| 3:1 split | 33.33% |
| 4:1 split | 25.00% |
| 7:5 split | 14.29% |
| 10:1 split | 10.00% |
| A single 2.3% dividend | 0.10% |
| A cumulative factor of 1.8734 | 0.01% |
So the test is worst at exactly the most common case. A clean two-for-one split leaves half the history sitting on the grid, because half of all cent values divide evenly by two — and half a file on the grid still reads as suspicious, but not as proof.
It is close to perfect on anything with a dividend in it. A single 2.3% adjustment left one price in a thousand on the grid, and a realistic cumulative factor left one in ten thousand. Any total-return series, any history spanning more than a couple of years of payouts, is caught immediately.
There is one derived price used more than all the others put together, and the grid disposes of it in a sentence: the mid of a market quoted one tick wide sits exactly half a tick from both sides.
Not usually. Always. A half tick is not on the grid, so on a one-tick-wide market there is no moment at which the mid is a price the venue could accept.
The general rule is that the mid is off the grid whenever the spread is an odd number of ticks. On twenty thousand simulated quotes weighted towards tight markets:
| Spread | Quotes | Mid off the grid |
|---|---|---|
| 1 tick | 10,019 | 100.0% |
| 2 ticks | 4,990 | 0.0% |
| 3 ticks | 2,446 | 100.0% |
| 4 ticks | 2,545 | 0.0% |
| All | 20,000 | 62.3% |
A backtest that fills at the mid on a one-tick market is therefore not being slightly optimistic about execution. It is assuming a fill at a price that could not exist, and the size of the assumption is exactly half the spread, every trade, in the same direction.
| Price | Spread | Understated by | Per side | Round trip |
|---|---|---|---|---|
| $42.30 | 1 tick | $0.005 | 1.18 bps | 2.36 bps |
| $42.30 | 2 ticks | $0.01 | 2.36 bps | 4.73 bps |
| $8.15 | 1 tick | $0.005 | 6.13 bps | 12.27 bps |
| $410.00 | 1 tick | $0.005 | 0.12 bps | 0.24 bps |
Turnover multiplies it in the obvious way. At 1.18 basis points a side, one round trip a day across the 251 sessions 2026 actually held comes to 5.9% of notional a year. That figure is the size of an assumption, not a claim about anybody's strategy — but an assumption of that size deserves to be written down rather than inherited.
The reflex is to hard-code a penny. It is wrong below a dollar on most venues, where sub-penny increments apply; wrong for the sub-penny programmes above a dollar; wrong for crypto by several orders of magnitude and differently for every symbol on the same exchange; and wrong for the same instrument before the last tick-regime revision.
That last one is the point people miss. Tick regimes get changed by rule and by pilot programme, which makes the grid a price had to sit on a point-in-time fact, exactly like who was in an index or which days a venue opened. Run today's tick table against a history from before a revision and the test reports a derived series where there is none.
>>> schedule.at(before_the_change).on_grid(price)
False
>>> schedule.at(after_the_change).on_grid(price)
True

>>> schedule.at(earlier_than_any_table)
ValueError: ... precedes the first tick table in this schedule;
the grid before it is not described here
Refusing is the right answer at the edge. A schedule that quietly falls back on its oldest table would turn a missing file into a confident verdict about a period nobody described.
Once you have a grid you need a rule for prices that are not on it, and the rule deserves more thought than it usually gets — for a reason that is specific to discrete prices.
On a continuous scale an exact half is a curiosity. On a tick grid it is routine: the mid of a one-tick market is a half tick every single time. So a tie rule is not a footnote about floating point, it is a systematic choice with a direction, applied to the most common derived price there is.
The other half of it is what rounding does to an order. Rounding a target to the nearest tick moves it to a price the strategy did not ask for, and half the time that is the more aggressive side — a buy placed above its own target. In a backtest that fills limit orders at their limit, that lifts the fill rate with nothing in the strategy having asked for it. Rounding a buy down and a sell up cannot do that.
The check is in our open-source market-data library, which is MIT licensed and has no runtime dependencies. A tick table is a two-column file of the price each band starts at and the increment inside it.
$ mdnorm ticks prices.csv --table nasdaq_ticks.csv
prices               49001
on the grid          24501
off the grid         24500
share on grid        50.00%
note: 24500 price(s) could not have been quoted on this grid, so this
series is not raw prints.
If you have a vendor file and no tick table for it, that is itself worth noticing. A price series without the grid it was quoted on is missing a piece of its own definition, and the vendor has it.
This is the fourth of these in a row that comes back to the same shape. A daily value joined at its label is readable before it existed. An index universe taken from today's list was chosen using the end of the period. A trading year assumed to be 252 sessions was 251. And a price assumed to be a price is often arithmetic. In every case the numbers are real, the file opens cleanly, nothing fails, and the result is better than it should be.
What we have deliberately decided against building is written down in the same place as what we have planned, and a default tick size is on that list for the reasons above. Comments people have left on the work, each linked to its original, are on our community page.
If you run the grid check on a file you were sold and it comes back derived, we would like to know what the vendor called it. That is more useful than any argument about methodology.
Check whether every price is an exact multiple of the venue's tick. A venue will not accept a price off its grid, so raw prints are on it by construction. A file that is not on the grid is a mid, a VWAP, an average across venues, a back-adjusted history, or an error. The test takes one pass and it is decisive in one direction: off the grid proves the series is derived, while on the grid only means it could have been quoted.
The smallest price increment a venue will accept for an instrument. It is usually banded, so the same instrument moves in one increment below a price threshold and a larger one above it, and the bands differ by venue and by asset class. It is also not fixed in time: tick regimes get revised, which makes a tick table point-in-time data rather than a constant.
Because the mid of a market quoted one tick wide sits exactly half a tick from each side, and half a tick is not on the grid. On a one-tick-wide market the mid is never a price the venue could accept. More generally the mid is off the grid whenever the spread is an odd number of ticks, which in a simulation of twenty thousand quotes came out at 62% of them.
Half the spread on every trade, because the mid sits half a spread from the side you would really have to take. On a one-tick market at $42.30 with a penny tick that is 1.18 basis points per side. The same half tick on an $8.15 name is 6.13 basis points, five times more, because the tick is a larger share of a cheaper price.
Sometimes, and the exception is worth knowing. A clean two-for-one split leaves half the history still on a cent grid, because half of all cent values divide evenly by two, so the test is weakest on the most common split. A dividend adjustment is a different story: adjusting a cent-grid history by a 2.3% factor left 0.10% of prices on the grid in our run, and a cumulative factor left 0.01%.
Yes, and this is the limit of the method. On-grid says the prices could have been quoted, not that they were, not that they are the right instrument, and not that they arrived when their timestamps claim. A derived series that somebody rounded onto the grid also passes. The test rules things out; it does not rule anything in.
Only if you say so, because rounding to the nearest tick moves the order to a price the strategy never asked for, and half the time that is the more aggressive side. Where a backtest fills limit orders at their limit, that lifts the fill rate on no instruction from the strategy. Rounding a buy down and a sell up cannot do that.
Yes, per symbol, and they are revised more often than equity ones. The increments differ by orders of magnitude across a single exchange's listings, so a hard-coded constant is worse there than anywhere, and the grid test needs the per-symbol table to mean anything.