
HarvestGroup360
© 2026 HarvestGroup360 — a brand operated by AMII LTD.
A daily value and a one-minute grid meet in almost every research pipeline. The join looks like an ordinary lookup and it is the place where a whole trading day of hindsight enters a feature without leaving a mark.
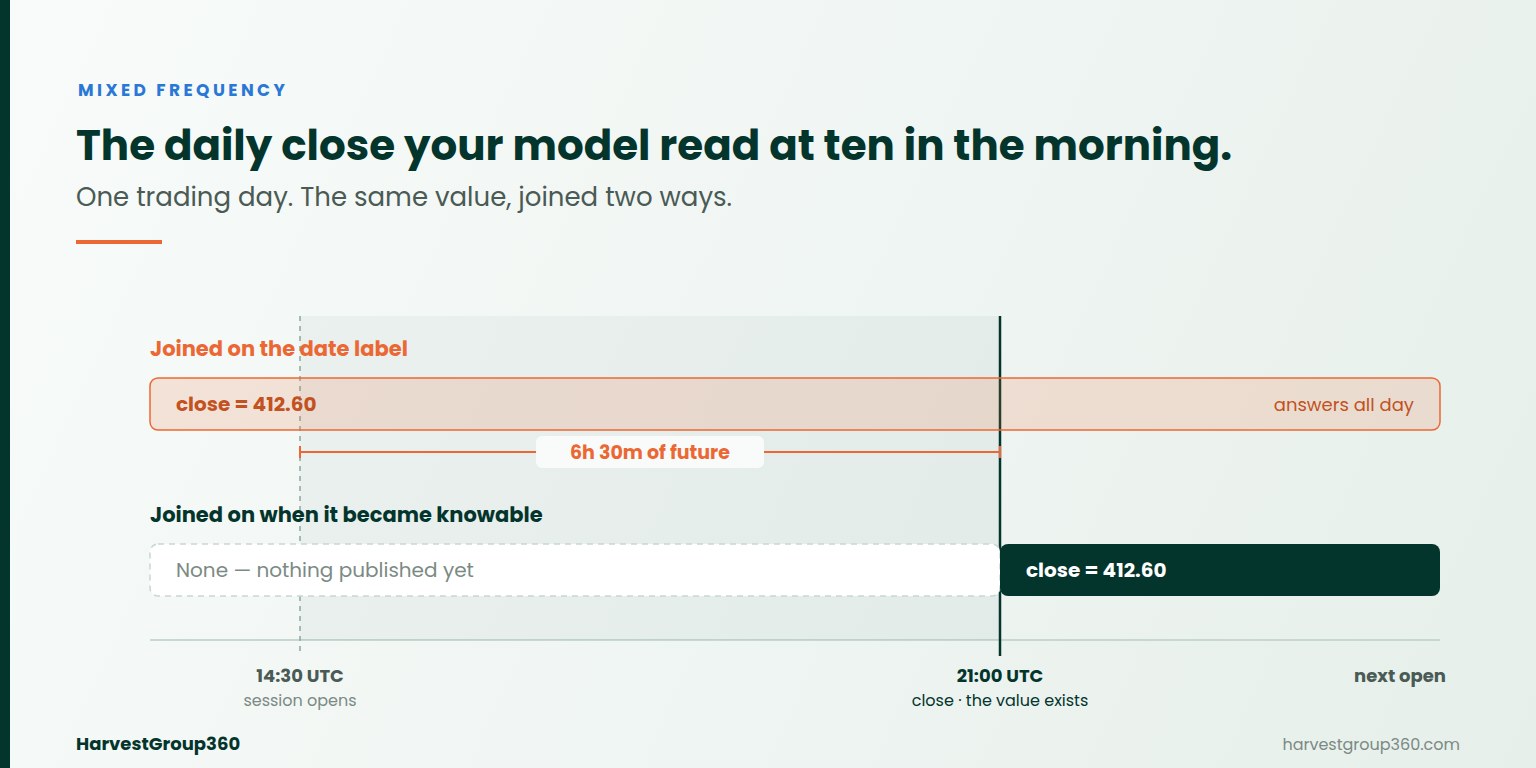
Here is the shape of it. You have a slow series — a daily close, a settlement price, an overnight risk figure, a vendor factor delivered once a day — and you want it beside a fast one. The slow file has a date column. The fast file has timestamps. You match each intraday row to the daily row that shares its date, and the pipeline runs without complaint.
Every minute of Tuesday now carries a number that summarises Tuesday. Including the part of Tuesday that, at that minute, has not happened.
The confusion is baked into how the data is shipped. A daily row is labelled with the period it describes. What a join needs is the moment the value became knowable. For an intraday series those coincide closely enough that nobody thinks about it. For a daily series they are a session apart.
That distinction is the same one behind auditing a pipeline for look-ahead bias and behind values that get corrected after publication. What makes the mixed-frequency case worth its own treatment is the size of the gap and how ordinary the mistake looks: no timestamp is out of order, no row is misdated, and every guard that checks whether a value arrived before it was used will pass, because by the label it did.
The leak is bounded by the length of the period, and for the common cases that is easy to state.
| Series | Label says | Actually knowable | Future leaked |
|---|---|---|---|
| US equity daily close | the calendar date | 16:00 New York, at the close | up to 6h 30m |
| 24-hour crypto daily | the calendar date | 00:00 UTC next day | up to 24h |
| Futures settlement | the trade date | at settlement, then published | session plus vendor delay |
| Weekly factor file | the week | after the week ends, on delivery | up to a week |
Six and a half hours sounds survivable until you ask what the feature feeds. A monthly rebalance will barely notice. A signal that trades every five minutes is being handed the answer.
The result that surprised us when we measured it: on a series of back-to-back periods, the label join is wrong at every grid point, not at some fraction of them.
The mechanism is simple once stated. Each period's label sits exactly where the previous period ends. So at the very instant Monday's value becomes readable, the label join has already switched to Tuesday's — and Tuesday's will not be readable for another full day. There is no moment at which a contiguous label-keyed series is showing you something that exists. Walk the grid forward and the join is either early or it is early by a different amount.
Real sessions are kinder, and the reason is worth noticing: a market closes before the next day's label begins. Between the close and the next open there is a genuine window in which the label join happens to be correct. On a US equity calendar that window is roughly seventeen and a half hours of every weekday, and all of it is time the market is shut. The damage is concentrated in exactly the hours you were trading.
A value existing and a value reaching you are different events. A settlement price exists when the session closes. It arrives when the vendor sends it, which might be minutes later or the following morning. Index constituents, reference rates and factor files all carry a delivery delay that is a property of your contract, not of the market.
We deliberately do not supply a default for that lag. A plausible constant — fifteen minutes, everybody uses fifteen minutes — would rescale an entire study while leaving its shape untouched, and a result that looks completely normal is the hardest kind of error to find. Zero is at least an explicit claim about your infrastructure that somebody can check and disagree with.
One more trap sits underneath the first. Daily bars are frequently stamped midnight to midnight regardless of when the venue was open. Take the bar's own end and you place a US equity close at 00:00, eight hours after it existed. Take the label and you place it at 00:00 the previous day, sixteen hours before. Neither is the close.
Deriving the end from a stated trading session fixes both, and disposes of daylight saving on the way. A 16:00 New York close is 21:00 UTC in January and 20:00 UTC in July, because the exchange keeps local time while UTC does not move. Any pipeline that hard-codes one of those two numbers is wrong for about half the year — a subject we went through in detail in trading sessions and time zones.
The useful move is to run both joins over the same grid and count the difference. Key the slow series by knowability, key it again by label, and report the points where the second answers and the first does not, along with the largest distance between them.
Version 1.18.0 of our open-source library does this. A slow series carries both keys — one safe to join, one kept deliberately so the error can be reproduced and sized — and a report counts the difference:
$ mdnorm mixfreq daily.csv --interval 3600000000000

periods              3
grid points          55
knowable             48
label join answers   55
of those, too early  21
worst read-ahead     23,400s
share leaking        38.2%
Three daily values, an hourly grid, one US equity session each. Twenty-one of fifty-five points read a number that did not yet exist, and the worst of them was read 23,400 seconds early — six and a half hours, which is precisely the session length, as it must be. Declare a thirty-minute publication lag and the worst case becomes 25,200 seconds. The figures move exactly as much as the assumption you changed, which is the point of stating assumptions as arguments.
In code the same thing is three lines, and the safe series joins like any other stream:
from mdnorm import PeriodSeries, leak_report, US_EQUITY_RTH

series  = PeriodSeries.from_sessions(daily_closes, US_EQUITY_RTH,
                                     publication_lag_ns=15 * 60 * 10**9)
feature = series.knowable_series()      # keyed at the close plus the lag
report  = leak_report(series, grid)     # what the label join would cost
There is no new join here. knowable_series() returns the same as-of series every other stream in the library returns, so it drops straight into an ordinary alignment beside your minute data. The only thing that changed is the key.
A leak count is an exposure, not a verdict. Twenty-one contaminated points out of fifty-five is alarming for a signal that acts within the session and close to irrelevant for one that acts at the next open. The same table supports both conclusions, and which one applies is a question about your strategy rather than your data.
What the number removes is the third option, the one most pipelines are quietly exercising: not knowing. If somebody asks how much hindsight is in a feature and the answer is a shrug, the honest reading is that it could be all of it.
This is the fourth item in a sequence that keeps arriving at the same place. As-of joins that read a bar too early, a ticker that named a different company, figures revised after publication, a universe assembled from the end of the period, and now a period label standing in for a moment. Each of them produces a number that is real, dated correctly, and unavailable at the time it was used. None of them fails loudly.
The library is MIT licensed, has no runtime dependencies, and the mixed-frequency module ships with the roadmap item that asked for it marked done. What we have decided against, and why, is in the same file. Comments people have left on the work, each linked to its original, are on our community page.
If you run the report on your own pipeline and the count comes back surprisingly large, we would rather hear about it than not. That number is more useful to us than any argument about methodology.
When the session it summarises has finished, and not before. A US equity close describes 09:30 to 16:00 New York, so it exists at 16:00 local — 21:00 UTC in January and 20:00 UTC in July, because the exchange keeps local time and UTC does not observe daylight saving. If the value also has to be published by a vendor, add that delay on top. The date on the row is the period it describes, which is a different thing.
Because the date is a label for the period, not a timestamp for the value. Matching a minute bar to the daily row that shares its date gives every minute of the day a number that summarises the whole day, including the minutes that have not happened yet. Nothing in the data looks wrong: the date is correct, the value is real, and every ordinary timestamp check passes.
For a US equity session, up to six and a half hours per day — the distance from the open to the close. For a 24-hour market it is the full day. In a worked example with three daily values on an hourly grid, 21 of 55 grid points read a value that did not yet exist, and the worst was read 23,400 seconds early. Adding a thirty-minute publication lag pushed the worst case to 25,200 seconds.
On back-to-back periods it affects every one. Each period's label is the previous period's close, so at the instant one value becomes readable the label join has already moved to the next period — which will not be readable for another full period. There is no moment at which a contiguous label-keyed series is showing something knowable. Real sessions do leave a safe window, because the market closes before the next label begins.
It is the delay between a value existing and reaching you. A settlement price exists at the close; it arrives when the vendor sends it. The right number depends on your feed and your contract, and a plausible wrong constant would rescale an entire study while leaving its shape untouched — the hardest kind of error to notice. A default of zero is at least a visible claim that you can check.
At its end, and at the end of the session rather than the end of the calendar day. Daily bars are frequently stamped midnight to midnight regardless of when the market was open, which places the close hours after it existed for one venue and hours before it for another. Deriving the end from a stated session removes both errors and handles daylight saving as a side effect. It does not handle the days the session itself was short, which is a separate calendar problem.
Run both joins over the same grid and compare. Key the slow series by the moment it became knowable, key it again by its label, and count the points where the second answers and the first does not. That count, plus the largest gap between the two, is the size of the error. A test that asserts the honest join returns nothing before the first close is worth more than a paragraph in a design document.
Not by itself, and this is where honest reporting matters. Reading a daily factor seven hours early barely moves a monthly rebalance and can dominate a five-minute signal. The count tells you the exposure; whether it is material depends on the horizon of the decision the number feeds. What it removes is the option of not knowing.