
HarvestGroup360
© 2026 HarvestGroup360 — a brand operated by AMII LTD.
A bug that makes your results worse is found within the hour. Somebody is annoyed, somebody digs, and it is fixed before lunch. A bug that makes your results better is found in a meeting, where it is being presented. That asymmetry is the reason look-ahead bias survives in research pipelines for years, and it is why the place to look for it is not the model but the join underneath it.
Almost every piece of quantitative research eventually needs the same object: a matrix with one row per timestamp and one column per instrument. Getting there from a handful of independent tick streams is an as-of join — for each grid point, take the most recent value each stream had produced. It is three lines of code in most libraries, it is applied identically to every row, and it is where the future gets in.
The first leak is the word "nearest". A join that finds the closest observation to a timestamp will, roughly half the time, find one that had not happened yet.
On a one-minute grid, a nearest-observation lookup at 09:30:00 will return a print from 09:30:20 whenever no print arrived in the preceding twenty seconds. Twenty seconds of hindsight does not sound like much. It is more than enough to make a mediocre signal look tradeable, because the thing you are predicting has, in a small but consistent fraction of rows, already partly happened.
The correct rule is dull and absolute: a value may appear on a row only if it was observed at or before that row's timestamp. Not nearest. Not interpolated between the two surrounding observations. The last one that had actually arrived.
The second leak is more interesting, because the data is not wrong and the join is not wrong — the timestamp means something other than what it appears to mean.
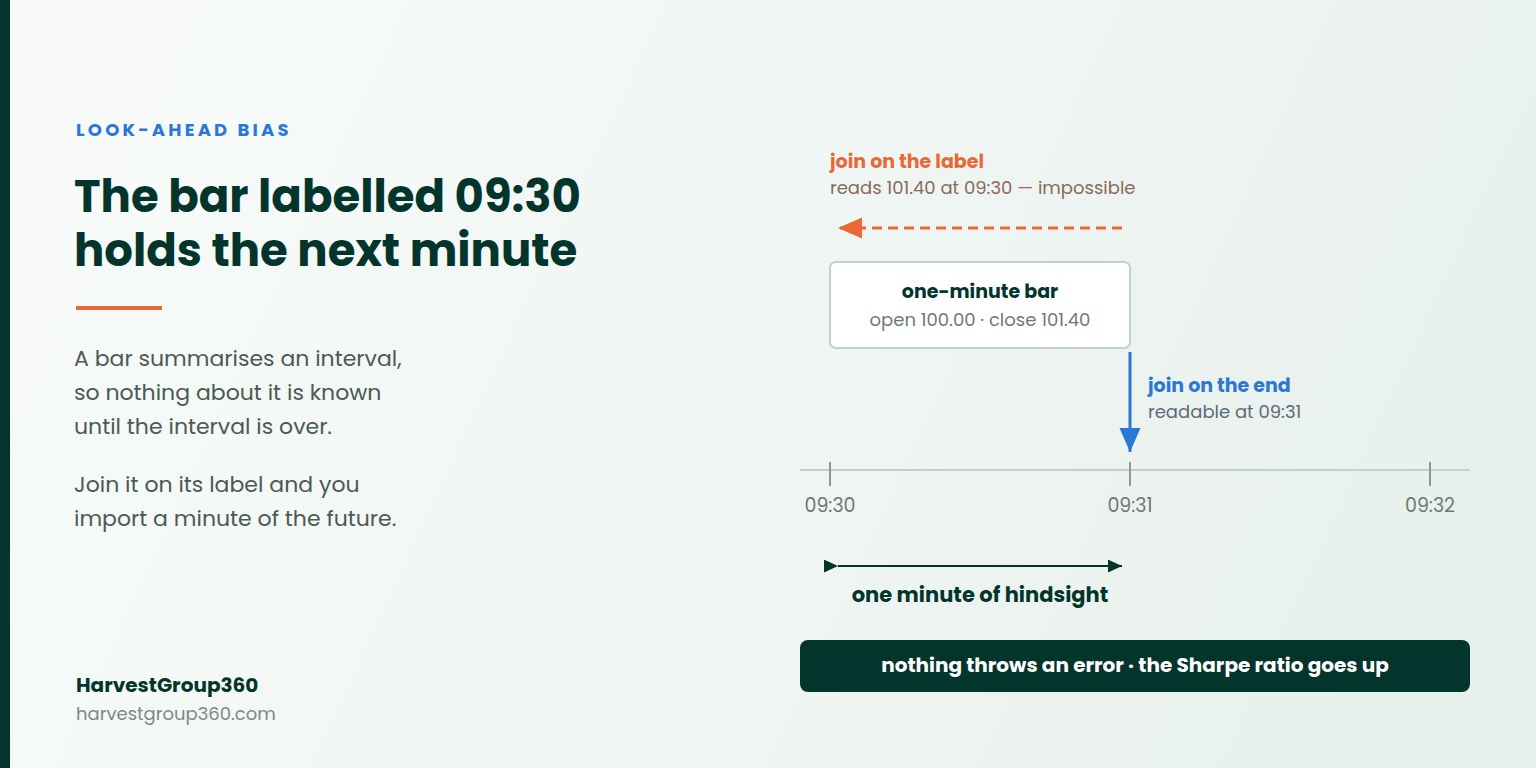
A one-minute bar labelled 09:30 covers everything that traded from 09:30 up to 09:31. Its close is the last print in that window. Its high and low are extremes over the whole minute. Its volume is the minute's total. None of those numbers exist at 09:30; all of them exist at 09:31.
Labelling a bar by the start of its interval is a completely reasonable storage convention, and nearly every vendor and library does it. The bug appears the moment that label is used as a join key. Join another series to those bars at 09:30 and every row of the resulting matrix contains one full interval of the future — silently, uniformly, and in a way that improves whatever you fit on it.
The fix is to read a bar at its close rather than at its label, which means a bar-derived column is deliberately one interval behind the grid point that produced it. Applying that correction is usually the moment a promising backtest becomes a flat one. The flat one is the true one. Corporate actions have the same property — an adjustment applied with the wrong effective date rewrites history in the same quiet way, which we covered in back-adjusting for splits and dividends.
Instruments do not update in lockstep, so forward-filling is not optional. What is optional is letting it run forever.
When a feed stops — a halt, a delisting, a dropped subscription, an exchange outage — the last value it produced keeps being carried into every subsequent row. The column does not look empty. It looks calm.
This is worse than a gap, and specifically worse in a way that flatters. A frozen price has zero variance. Zero variance means it correlates with nothing. And a series that correlates with nothing is exactly what a risk model is looking for. A dead feed does not present itself as a data problem; it presents itself as a diversifier, and it will be allocated to accordingly.
A staleness window fixes it: past some age, a forward-filled value stops being used. The age itself is worth carrying alongside every value, because it separates two very different kinds of blank. A column that has never produced an observation is a gap at the start of history and is expected. A column whose newest observation is four hours old in the middle of a live session is a fault. Collapsing both into an empty cell hides the one you needed to see.
Every timestamp in a raw feed answers the question "when did this happen at the source". Research needs the answer to a different question: "when could I have acted on this".
Those differ by the delivery delay — network, publication schedule, vendor batching, your own ingestion. A value stamped at 09:30:00.000 and received 250 milliseconds later must not be visible to a decision taken at 09:30:00.100, and treating source timestamps as arrival timestamps quietly assumes an infrastructure nobody has. The honest treatment is to shift the observation times forward by the delay you actually have before the join runs, and to treat a delay of zero as a claim requiring evidence rather than a default. What that delay is made of, physically, is the subject of the true cost of latency.
None of these are exotic. They are defaults — in libraries, in tutorials, in code that has been in production for years. What they have in common is direction: each one makes the numbers better.
A pipeline that is too slow gets profiled. A pipeline that returns nonsense gets debugged. A pipeline that returns a slightly better Sharpe ratio than it should gets deployed, and the person who would have found the error has no reason to go looking. Errors that flatter are not found by ordinary diligence, because ordinary diligence is triggered by disappointment.
Which means they have to be found by construction instead: a rule stated up front, and a test that checks the rule rather than the outputs.
The rule for everything downstream of an as-of join can be written in one line: no value at index i may depend on anything after index i.
That statement is directly testable, and the test is the same for every function that obeys it. Take an input, compute the outputs. Change the tail of the input to something wildly different. Compute again. Every output before the point of change must be identical — not close, identical. Anything that fails has a path from the future into the present, wherever it happens to be hidden.
We run that check across every function in our own feature layer, and it is worth saying that when we first ran it, it failed — on the correlation function. The leak turned out to be in the test, not the library: we had built the second input series by reversing the first, so changing the tail of one also changed the head of the other. The test was looking ahead. That is a fair illustration of how quietly this class of error moves around, and of why the check belongs in the suite permanently rather than being run once.
In our open-source tooling the alignment step is explicit about all three:
from mdnorm import align

rows = align({"BTC": btc_events, "ETH": eth_events},
             interval_ns=60_000_000_000,      # a one-minute grid
             max_age_ns=5 * 60_000_000_000)   # nothing older than five minutes

rows[0].values     # one value per instrument
rows[0].ages_ns    # how old each of them was
rows[0].stale      # columns dropped for being too old
rows[0].missing    # columns that never had data yet
Bars enter the same matrix through a constructor that stamps them at their close, so a bar column is the last closed bar rather than the one currently forming. A feed with a known delivery delay is shifted before it joins. And from the command line, the same thing over files:
$ pip install market-data-normalizer
$ mdnorm align BTC=btc.csv ETH=eth.jsonl --interval 1m --max-age 5m -o matrix.csv
Omit --max-age and the command says so out loud, because a forward-fill with no expiry is a decision and should be made deliberately rather than by omission. The layers this sits on top of — normalization, sessions, corporate actions, order books, trade classification — are described across our engineering notes: the full path from a raw feed to research-ready data in the market data normalization guide, session boundaries in trading sessions and time zones, and recovering the aggressor side in trade classification. The delivery side is documented in our API reference.
Every correction described here makes your own numbers worse. The backtest that survived the nearest-observation join does not survive the as-of one. The strategy built on bar labels loses an interval of edge it never had. The portfolio that looked diversified turns out to have been holding a dead feed.
We have come to treat that direction as the signal rather than the cost. A measurement that can only improve when you fix it was not measuring anything in the first place — the same argument that applies to execution benchmarks that contain your own trades, and the reason we would rather ship a library that reports less. The stage-by-stage version of this, as a checklist, is in auditing a pipeline for look-ahead bias. A join can also be correct in time and still be wrong about identity, if the ticker it matched on named a different company at that moment — the reference file that prevents it is covered in building a point-in-time symbol map.
The implementation is public and free to inspect on GitHub and installable from PyPI. If you are building research infrastructure on these foundations, our partnership page is open to independent developers and firms alike.
Look-ahead bias is the use of information in a backtest or model that would not have been available at the moment the decision was made. It does not usually arrive as an obvious mistake such as trading on tomorrow's price; it arrives through the plumbing — a join, a label, a fill rule — and its distinguishing feature is that it makes results better rather than raising an error.
An as-of join attaches to each timestamp the most recent value of another series that was observed at or before that timestamp. It is the standard way to put several instruments, updating at different times, onto one common grid. The correctness of an entire feature matrix depends on the join being strictly backward-looking, because it is applied identically to every row.
Because “nearest” can mean nearest in the future. On a one-minute grid a nearest lookup will happily return a print from 09:30:20 at the grid point 09:30:00. Twenty seconds of hindsight is enough to make a signal look tradeable, and nothing in the output indicates it happened. An as-of join should only ever search backwards.
For any downstream join it should be timestamped at its end. A one-minute bar labelled 09:30 contains everything that traded up to 09:31, so its close, high, low and volume are not knowable at 09:30. Labelling by the interval start is a perfectly reasonable convention for storage, but reading a bar at its label imports a full interval of the future into whatever you join it to. The same error scaled up to a daily value, where the interval is a whole session, is covered in joining a daily value to an intraday grid.
Forward-filling is necessary — instruments do not update in lockstep — but a forward-fill with no expiry is a problem. A halted, delisted or disconnected feed will otherwise contribute its last known price to every subsequent row. A frozen price has no variance, so it correlates with nothing, and a series that correlates with nothing reads to a risk model as diversification rather than as a dead feed.
By carrying the age of every value alongside the value itself. A column that has never produced an observation is a gap at the start of history and is expected; a column whose newest observation is hours old inside a live session is a fault. Collapsing both into a single blank hides the second case, which is the one worth investigating.
By shifting its observation times forward by the delivery delay before the join, so it cannot be read before it would have arrived. A value stamped at the source at 09:30:00.000 and received 250 milliseconds later should not be visible to a decision taken at 09:30:00.100. Treating source timestamps as arrival timestamps assumes an infrastructure nobody has.
Yes. HarvestGroup360 maintains market-data-normalizer, an MIT-licensed Python library that aligns several instruments onto one time grid with a strictly backward-looking as-of join, timestamps bars at their close, expires forward-filled values through a staleness window, and can model a feed's delivery delay. Install it with pip install market-data-normalizer (the import name is mdnorm); it has no runtime dependencies and the source is public at github.com/Harvestgroup360/market-data-normalizer.