
HarvestGroup360
© 2026 HarvestGroup360 — a brand operated by AMII LTD.
There is a class of defect in quantitative research that ordinary diligence never finds, because ordinary diligence is triggered by disappointment. A pipeline that is slow gets profiled. One that returns nonsense gets debugged. One that returns a slightly better result than it should gets deployed. What follows is the checklist we run against our own work, arranged by the stage where each problem enters.
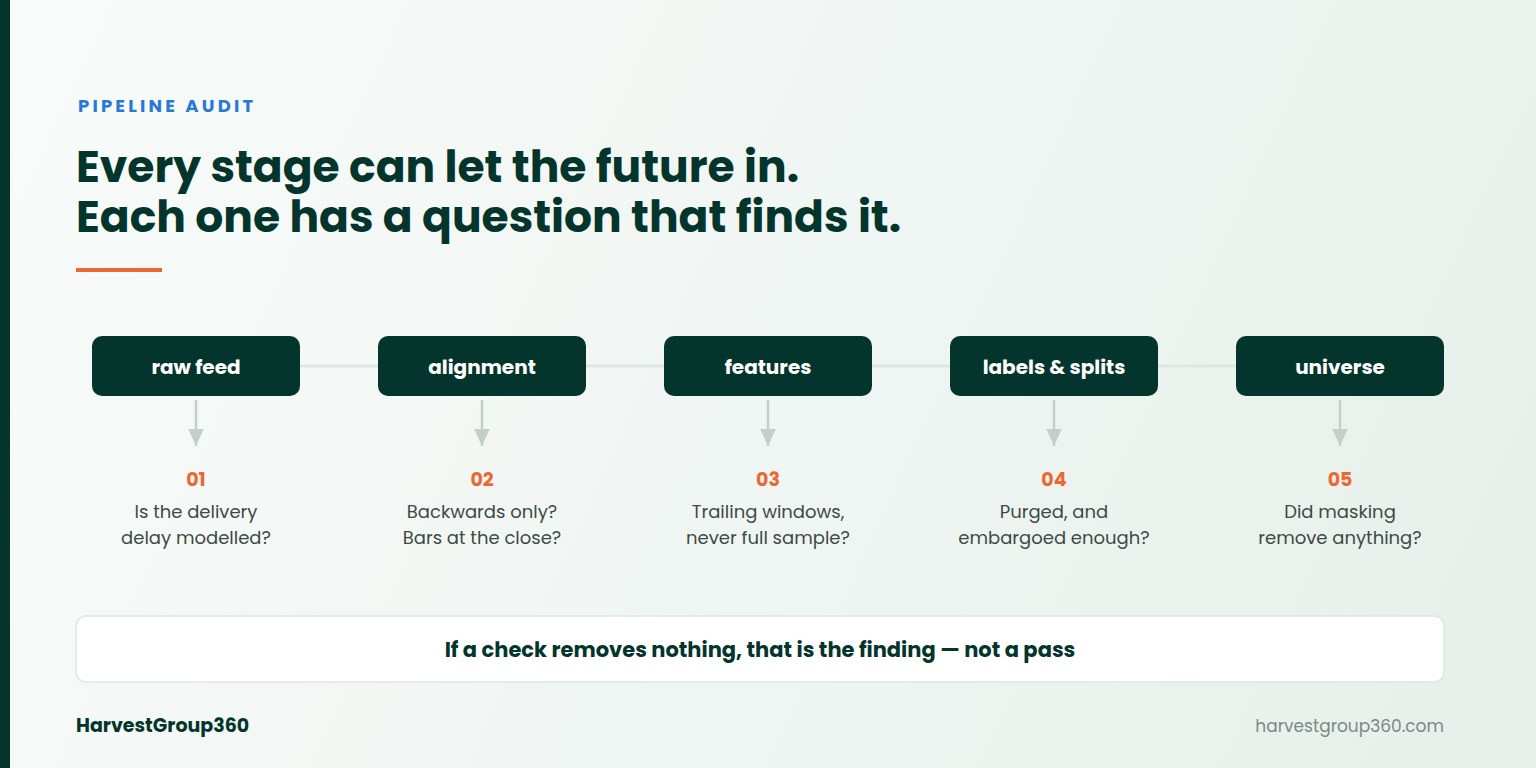
Nine questions, five stages. None of them is difficult to answer. The difficulty is that nothing in the pipeline will ask them for you, and every one of them, answered honestly, makes the reported numbers worse.
1. Is the delivery delay modelled, or assumed to be zero?
Every timestamp in a raw feed answers "when did this happen at the source". Research needs the answer to a different question: "when could I have acted on it". Those differ by network time, publication schedule, vendor batching and your own ingestion. A value stamped at 09:30:00.000 and received 250 milliseconds later must not be visible to a decision taken at 09:30:00.100.
A delay of zero is not a default. It is a claim about your infrastructure, and it should be written down as one. The physical components of that delay are the subject of the true cost of latency. A slower feed has the same problem on a different scale, and a daily value carries a session of it.
2. Does the join search backwards only?
An as-of join attaches to each grid point the most recent value each stream had produced. If the implementation looks for the nearest observation rather than the latest one preceding it, roughly half of its answers come from the future. On a one-minute grid this returns a print from 09:30:20 at the grid point 09:30:00 whenever nothing arrived in the preceding twenty seconds.
3. Are bars read at their close, or at their label?
This is the check that fails most often, and the data is not even wrong — the timestamp simply means something other than it appears to. A one-minute bar labelled 09:30 covers everything that traded until 09:31. Join another series to it on that label and every row of the matrix contains a full interval of the future. We took this one apart in detail in look-ahead bias in as-of joins.
4. Does forward-filling expire?
Instruments do not update in lockstep, so filling forward is necessary. Letting it run without limit is not. A halted or disconnected feed otherwise contributes its last value to every subsequent row, and because a frozen price has no variance it correlates with nothing — which reads to a risk model as diversification rather than as a fault.
5. Can you tell a stale column from an empty one?
A column that has never produced an observation is a gap at the start of history and is expected. A column whose newest value is four hours old in the middle of a live session is a fault. If both appear as the same blank cell, the second one is invisible. Carrying the age of every value alongside the value itself is what separates them.
6. Is every statistic trailing, or is something standardised over the whole sample?
Subtracting the mean and dividing by the standard deviation of an entire series is one line of code, appears throughout published work, and gives every observation knowledge of a distribution nobody had at the time. The same applies to any normalisation, winsorisation or scaling fitted on the full history and then applied backwards over it.
7. Do any training rows share a label window with the test block?
A label spanning the next five bars makes rows 100 and 103 describe overlapping stretches of the future — they share four fifths of their outcome. Put one in training and the other in test and the model has seen most of the answer. Shuffling does not help; it is the operation that mixes them.
This is measurable rather than a matter of judgement. Forty samples split into four contiguous folds with a five-bar horizon leave exactly five contaminated training rows — 15 through 19 — against the fold covering rows 20 to 29. Purging removes those five, and the number it removes should be reported rather than absorbed silently.
8. Is there an embargo, and is it at least the longest feature window?
Purging handles the rows before a test block. Features have memory, so the rows immediately after it are contaminated too: a rolling sixty-period statistic computed just past the boundary is built partly from observations inside the block. An embargo of zero is the default in most code because the correct value cannot be known by the splitting function — it is a property of your features.
9. Is membership point-in-time, and are the values the versions that were published then?
Two distinct problems share this stage, and both are invisible in the output.
The first is the sample. A list of instruments assembled today did not exist ten years ago; every name on it is a name that survived. Nothing about the resulting study looks strange, because every number in it is real. The only remedy is a record of who was actually tradable at each moment, applied before anything is ranked or compared — and how much a today-list costs, in names, is a number worth computing before deciding it is small. A related trap sits in the same file, because a ticker is not a permanent name for a company: building and validating a point-in-time symbol map covers it on its own terms.
The second is the version. A figure published in April at 2.1 and revised in May to 1.6 gives a decision taken on 30 April exactly one legitimate value, and it is not the one in your database today. The row is dated correctly, the number was genuinely published, and every check above passes. Handling it requires two timestamps per observation: the period described, and the moment it became knowable.
The individual questions catch known mechanisms. There is also one property that everything downstream of an as-of join must satisfy, and it is worth asserting directly because it catches mechanisms you have not thought of:
No value at index i may depend on anything after index i.
That is testable in four lines. Compute the outputs, replace the tail of the input with wildly different numbers, compute again, and every output before the point of change must be identical — not close, identical.
base     = [100, 101, 102, 103, 104, 105, 106, 107]
tampered = base[:5] + [9999, 8888, 7777]

assert feature(base)[:5] == feature(tampered)[:5]
We run this across every function in our own feature layer. It is worth saying that the first time we ran it, it failed — on the correlation function. The leak was in the test rather than the library: we had built the second input series by reversing the first, so changing the tail of one also changed the head of the other. Our look-ahead test was looking ahead. That is a fair illustration of how quietly this class of error moves around, and of why the check belongs in the suite permanently.
Not a column of zeros. This is the part that surprises people.
A real audit reports non-zero removals at several stages: rows purged per fold, rows dropped to the embargo, cells masked outside their listing window, columns retired for staleness, events that were revised and by how much. Those counts are the evidence that the checks met data capable of expressing the problem.
A report full of zeros usually means something else. If nothing is masked over a ten-year window, the membership file is present-day membership. If no fold purged anything, the horizon is not being passed through. If no value was ever retired for staleness, the staleness window is unset. In each case the zero is the finding.
This is why we built the counts into the tooling rather than leaving them to be inferred. Every guard reports its own work, and the command line says so out loud when a guard was configured in a way that cannot remove anything.
The library is open source, MIT-licensed and has no runtime dependencies. The checks above correspond to concrete arguments rather than conventions to remember:
$ pip install market-data-normalizer

$ mdnorm align BTC=btc.csv ETH=eth.csv --interval 1m --max-age 5m -o matrix.csv
$ mdnorm features matrix.csv --returns log --zscore 60 --vol 60 -o feats.csv
$ mdnorm labels feats.csv --column BTC --horizon 5 --splits 5 --embargo 60 -o ml.csv
$ mdnorm universe matrix.csv --listings listings.csv --pct-rank -o pit.csv
$ mdnorm revisions gdp.csv -o published.csv
Omit --max-age or leave --embargo at zero and the commands say so, because both are decisions and should be made deliberately rather than by omission. The stages beneath all of this — normalisation, sessions, corporate actions, order books, trade classification — are covered across our engineering notes: the full path from a raw feed in the market data normalization guide, session boundaries in trading sessions and time zones, corporate actions in back-adjusting for splits and dividends, aggressor side in trade classification, and benchmark contamination in the VWAP benchmark that flatters you. Delivery is documented in the API reference.
Every check on this list makes our own results worse, and we would rather ship a library that reports less. That position is the one we set out on our LinkedIn company page: the work is public, it is meant to be used by anyone, and the errors we found along the way are in the changelog rather than quietly removed from it.
A shorter treatment of the four underlying biases, written for a general audience, is on Medium. The implementation is on GitHub and installable from PyPI. If you are building research infrastructure on these foundations, our partnership page is open to independent developers and firms alike.
Stage by stage rather than as a single question. Ask whether the join that built the feature matrix searches backwards only; whether bars are read at their close or their label; whether forward-filled values expire; whether the label horizon overlaps the test block; whether the universe is point-in-time; and whether the values are the versions that were published then. Each stage has a different mechanism, and a pipeline can be clean at four of them and leak at the fifth.
A dataset that answers what was knowable at a given moment rather than what is true now. In practice that means three separate things: values observed at or before the timestamp, membership limited to instruments that were tradable then, and the version of each value that had actually been published by then. A dataset can satisfy the first and fail the other two.
A label spanning the next N observations makes rows N apart describe overlapping futures, so a training row within N of a test block has already revealed most of the answer. Purging removes those rows. The count is roughly the label horizon per fold boundary: forty samples in four folds with a five-bar horizon lose five rows to the fold covering rows 20 to 29.
At least the longest feature window in the dataset. A rolling sixty-period statistic computed immediately after a test block is built partly from observations inside it, so those training rows are contaminated even though their labels are not. There is no safe default because the correct value is a property of your features, not of the splitting function.
Apply point-in-time membership and count what it removes. Over a multi-year window a real listing history removes a substantial number of cells, because instruments delist, get acquired and stop trading. A count of zero almost always means the membership file describes today's market rather than the past one, which is the bias itself expressed as a number.
Yes, and it is the variant no timestamp check catches. The row is dated correctly and the value was genuinely published; nothing marks it as unavailable until the revision appeared weeks later. Handling it requires two timestamps per observation — the period described and the moment it became knowable — so a query can ask for the version that existed at the time.
By testing the rule rather than the outputs. Everything downstream of an as-of join obeys one statement: no value at index i may depend on anything after index i. Compute the outputs, replace the tail of the input with wildly different values, compute again, and every output before the point of change must be identical. Anything that fails has a path from the future into the present.
Not a set of zeros. A clean audit reports non-zero removals at several stages: rows purged per fold, cells masked outside their listing window, columns retired for staleness, events that were revised. Those counts are the evidence the checks ran against real data. A report full of zeros usually means the inputs cannot express the problem rather than that the pipeline is free of it.