
HarvestGroup360
© 2026 HarvestGroup360 — a brand operated by AMII LTD.
A trade file gives you a timestamp, a price and a size. What it almost never gives you is the aggressor: which side crossed the spread to make the trade happen. That one absent column is the boundary between a price series and an order-flow series, and recovering it is a solved problem with a known, uncomfortable error rate.

Two trades print at 101. In the first, a buyer lifted a resting offer. In the second, a seller hit a resting bid that happened to sit at the same level. The price is identical and the informational content is opposite: one says demand was impatient, the other says supply was.
Almost every quantity in market microstructure is defined in terms of that distinction. Signed volume is. Order flow imbalance is. Effective spread decomposition, Kyle's lambda, the entire family of imbalance-driven sampling schemes — all of them start by asking who was the aggressor. And almost no public data source answers.
This is not an oversight. An exchange matching engine knows precisely which order was resting and which arrived to take it, but that information is a byproduct of matching rather than a product of it. Public tapes were designed to report what happened to the price, not to reconstruct intent, and many were specified decades before order-flow analysis became routine.
Some venues do report it. Several crypto exchanges publish an explicit maker/taker flag on every trade, which is one of the few places retail-accessible data is richer than equity market data. Where that flag exists it should always be preferred over any inference — it is ground truth, and no rule beats ground truth.
Everywhere else, the side has to be inferred.
The literature converged on three approaches, each needing more data than the last.
The tick rule compares each trade with the previous trade at a different price. An uptick is treated as buyer-initiated, a downtick as seller-initiated. A trade at an unchanged price inherits the direction of the last change — the so-called zero-uptick and zero-downtick cases. It requires only the trade tape, which is why it survives as the universal fallback despite being the weakest of the three.
The quote rule compares the trade price with the prevailing quote midpoint. Above the mid, the trade is assumed to have hit the ask and is therefore buyer-initiated; below the mid, seller-initiated. It is materially more accurate than the tick rule and it needs a synchronised quote stream, which many datasets do not include.
Lee-Ready, published in 1991, is the quote rule with the tick rule as a fallback for trades printing exactly at the mid, where the quote genuinely cannot decide. It remains the practical standard, and it is the default in most implementations for a simple reason: it degrades gracefully. Where the quote is available it uses it, and where it is not it still returns an answer.
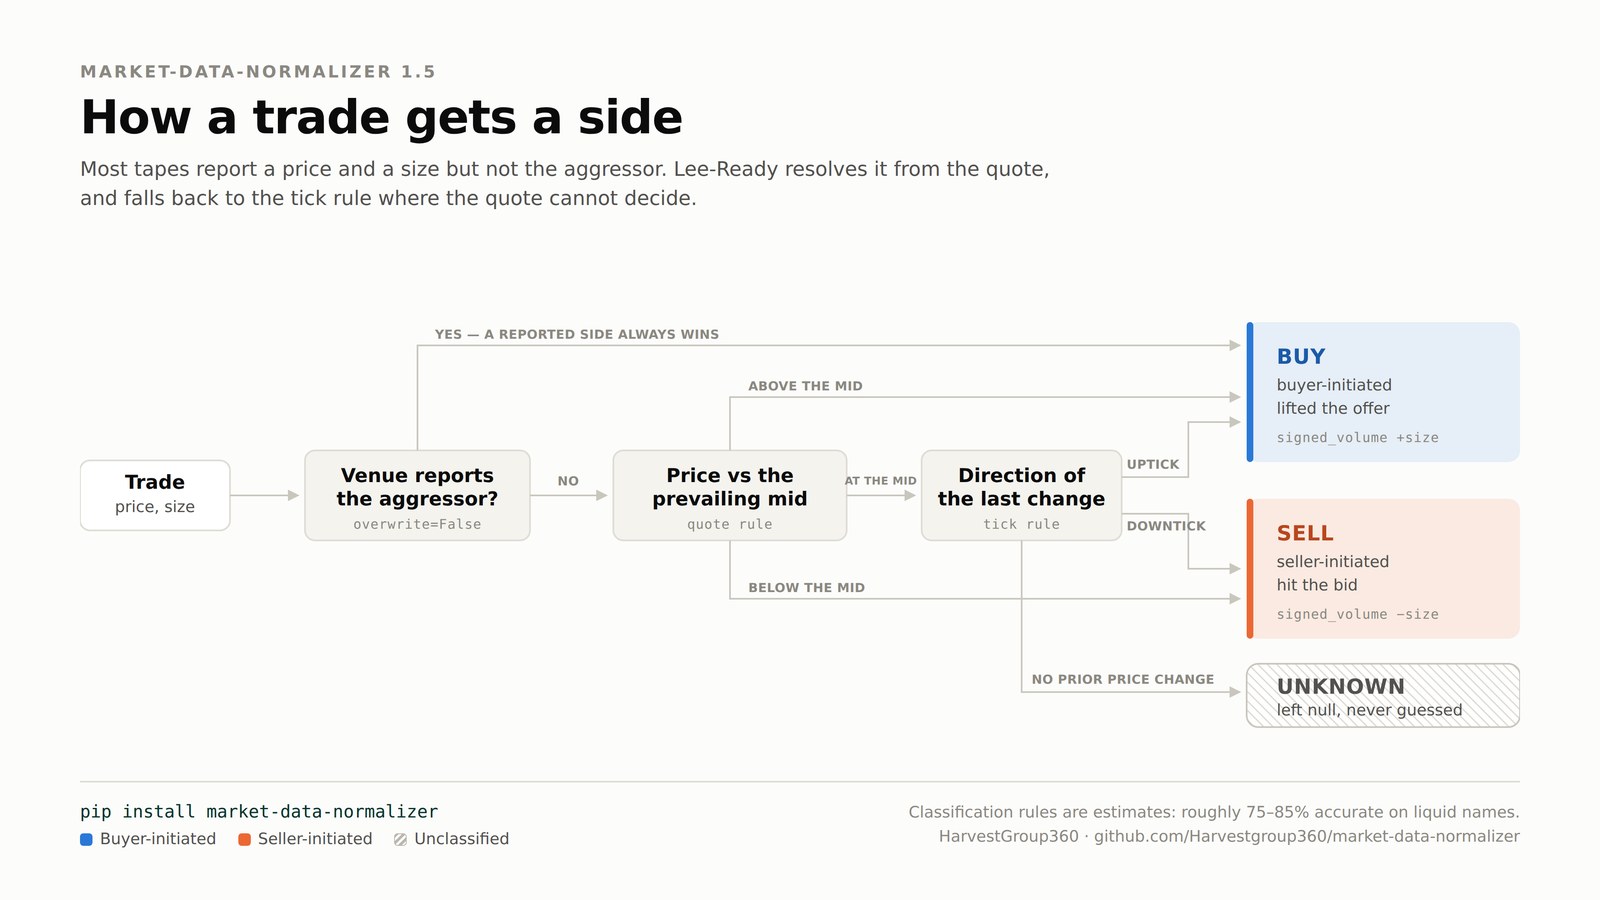
These rules are wrong between fifteen and twenty-five percent of the time.
Published accuracy on liquid US equities runs at roughly 75 to 85 percent, and that is the favourable case. Accuracy degrades for trades executed inside the quote, for large blocks worked over time, in fast markets where the quote a trade should be compared against is genuinely ambiguous, and in any venue where reporting latency decouples the trade timestamp from the quote timestamp.
Two consequences follow, and they are the difference between a dataset that can be trusted and one that cannot.
First, an inferred side must never be presented as though the venue reported it. If a pipeline overwrites a real maker/taker flag with a guess, it has destroyed information and replaced it with something worse.
Second, a rule that cannot decide should say so. A trade with no prior price change and no quote is unclassifiable, and the correct output is a null, not a coin flip dressed as data. This is the same principle we applied to reference prices in back-adjusting for corporate actions, and to a benchmark window containing only your own trade in execution measurement: a field that admits it is empty is more useful than a field that is confidently wrong.
Lee and Ready matched each trade against the quote in force five seconds earlier. The correction was right for its time: trades on 1980s tapes were reported with a delay the quotes did not share, so comparing a trade against its contemporaneous quote compared it against the future.
That five-second lag is still copied into implementations today, and on a modern feed with hardware timestamps it is usually wrong — five seconds is an eternity, and the quote it selects may be several regimes old. The lag should be a parameter chosen from the characteristics of the specific feed, and it should default to zero. Where the timestamps in a dataset come from and how far apart they can drift is a question we looked at from the hardware side in what HFT infrastructure looks like and the true cost of latency.
Signed volume is buy volume minus sell volume: the simplest measure of net directional pressure over a window.
Order flow imbalance normalises that to a fraction between minus one and plus one. One detail matters here more than it looks: when no trade in a window could be classified, the correct answer is null rather than zero. A balanced tape and an unlabelled tape are different states of the world, and collapsing them into the same number is how a feature quietly becomes noise.
Effective spread — twice the absolute distance between a trade price and the prevailing mid — measures what the trade actually paid to cross. It diverges from the posted spread whenever execution happens inside or outside the quote, which is most of the time on a modern venue.
And Roll's estimator, from 1984, recovers an implied spread from the serial covariance of price changes alone. It needs neither quotes nor sides, which is exactly what makes it valuable: because it shares no inputs with the other measures, it functions as an independent check. When inferred sides and posted spreads tell one story and Roll tells another, one of the inputs is wrong.
Roll's estimator carries its own assumption — that trade signs are serially uncorrelated — and it is biased upward when they are not. A Roll spread that badly exceeds the posted spread is therefore evidence about the sign process rather than about liquidity. Knowing which of your tools is lying, and in which direction, is most of data quality; we covered the general version of that argument in the hidden cost of dirty market data.
Once trades carry a side, the sampling clock itself becomes a choice.
A one-minute bar samples the market on a schedule that has nothing to do with the market. Volume bars improve on that by sampling on activity. Imbalance bars go one step further and sample on directional activity: the bar runs until buyers have outbought sellers, or the reverse, by a threshold, and then resets.
Quiet two-sided trading produces one long bar. A sustained one-sided push produces several short ones. The bar boundary follows information arrival rather than the wall clock, which is the whole argument for the technique — and a useful corrective to the assumption, examined in the overfitting trap, that a model's problems live in the model rather than in how its inputs were sampled.
The rules are short. Prefer a venue-reported aggressor over any inference. Use Lee-Ready where quotes exist and the tick rule where they do not. Set the quote lag from the feed rather than from a 1991 paper. Leave unclassifiable trades null. Record which rule produced a dataset, because two files classified by different rules are not comparable. And sanity-check the result against an estimator that shares none of its inputs.
In our open-source tooling that looks like this:
from mdnorm import SideRule, infer_sides, trade_imbalance, roll_spread

classified = infer_sides(events, rule=SideRule.LEE_READY)

print(trade_imbalance(classified))   # -1 selling ... +1 buying
print(roll_spread(classified))       # independent cross-check
Or straight to imbalance bars, without writing any Python:
$ pip install market-data-normalizer
$ mdnorm bars tape.jsonl --infer-sides \
      --every-imbalance 500 -o imbalance.csv
--side-rule selects between tick, quote and lee_ready, and --imbalance-by tick measures the imbalance in trade count rather than in size. The wider pipeline this fits into — canonical schemas, deduplication, quality checks, bar sampling — is described in our market data normalization guide, and the session-handling problem that sits alongside it in trading sessions and time zones.
A closing detail, because it is the kind of thing that decides whether numbers can be trusted.
Our first test of Roll's estimator used alternating prints of 99 and 101 — a flat mid, a spread of 2. The function returned 4. The convenient response was to loosen the assertion; instead we ran the estimator over twenty thousand randomly signed trades and got 2.0045. The implementation was correct and the test data was pathological: strict alternation is the maximally autocorrelated sign sequence, precisely the case Roll's model excludes, and violating it doubles the estimate.
The failing test became two: one confirming the estimator recovers the spread under the model's assumptions, one pinning the exact bias when they break. The limitation now lives in the function's own documentation rather than in someone's dashboard.
The implementation is public and free to inspect on GitHub and installable from PyPI. For the delivery side of this data, see our API documentation; if you are building research on these foundations and want to talk, our partnership page is open to independent developers and firms alike.
Trade classification is the process of working out which side of a trade was the aggressor — whether the buyer crossed the spread to lift the offer, or the seller crossed it to hit the bid. Most public trade feeds report the price, the size and the timestamp but not this field, so it has to be inferred from the surrounding data using a classification rule.
The tick rule classifies a trade by comparing its price with the previous trade at a different price. An uptick is treated as buyer-initiated, a downtick as seller-initiated, and a trade at an unchanged price inherits the direction of the last change. It needs nothing but the trade tape, which makes it the universal fallback, and it is the least accurate of the three common rules.
The Lee-Ready algorithm, published by Charles Lee and Mark Ready in 1991, classifies a trade by comparing its price with the prevailing quote midpoint: above the mid is buyer-initiated, below is seller-initiated. For trades that print exactly at the mid, where the quote cannot decide, it falls back to the tick rule. It remains the practical standard for trade sign inference.
Published studies put the accuracy of these rules at roughly 75 to 85 percent on liquid US equities, meaning between one in four and one in seven trades is labelled wrongly. Accuracy falls in fast markets, for trades inside the quote, and for large blocks. An inferred side should be treated as an estimate, and a classified trade should never be presented as though the venue reported it.
Because it is what turns a price series into an order-flow series. Signed volume, order imbalance, effective spread decomposition, Kyle's lambda and imbalance bars are all defined in terms of the aggressor. Without it, a dataset can show that the market traded at a price but not whether that print represented buying pressure or selling pressure.
Order flow imbalance is buy volume minus sell volume over a window, usually normalised by total volume so that it runs from minus one, entirely seller-initiated, to plus one, entirely buyer-initiated. It is the simplest summary of directional pressure in a tape and it cannot be computed at all without a side on each trade.
Imbalance bars are a sampling scheme that closes a bar when cumulative signed order flow reaches a threshold in either direction, rather than after a fixed period of time or a fixed quantity of volume. Quiet two-sided trading produces long bars and sustained one-sided pressure produces short ones, so the sampling clock follows information arrival.
Yes. HarvestGroup360 maintains market-data-normalizer, an MIT-licensed Python library that implements the tick rule, the quote rule and Lee-Ready, and computes signed volume, trade imbalance, effective spreads, Roll's spread estimator and imbalance bars. Install it with pip install market-data-normalizer (the import name is mdnorm); it has no runtime dependencies and the source is public at github.com/Harvestgroup360/market-data-normalizer.