
HarvestGroup360
© 2026 HarvestGroup360 — a brand operated by AMII LTD.
Almost every desk measures execution the same way: compare the average price you paid against the volume-weighted average price of the market over the same window. Beat VWAP, you traded well. The benchmark has a defect that everyone in the industry knows about and very few tools do anything about — the tape it is computed from contains your own trades.
The consequence is easy to state and uncomfortable to sit with. When VWAP is computed over the window you were trading in, your own executions are part of the average you are being scored against. You are benchmarking yourself, in part, against yourself.
If the bias were random it would be a nuisance. It is not random. It always flatters. That one-directional property is what makes a measurement dangerous rather than merely imprecise, and it recurs elsewhere: a backtest chosen as the best of many trials is flattered by the selection itself, in exactly the same direction.
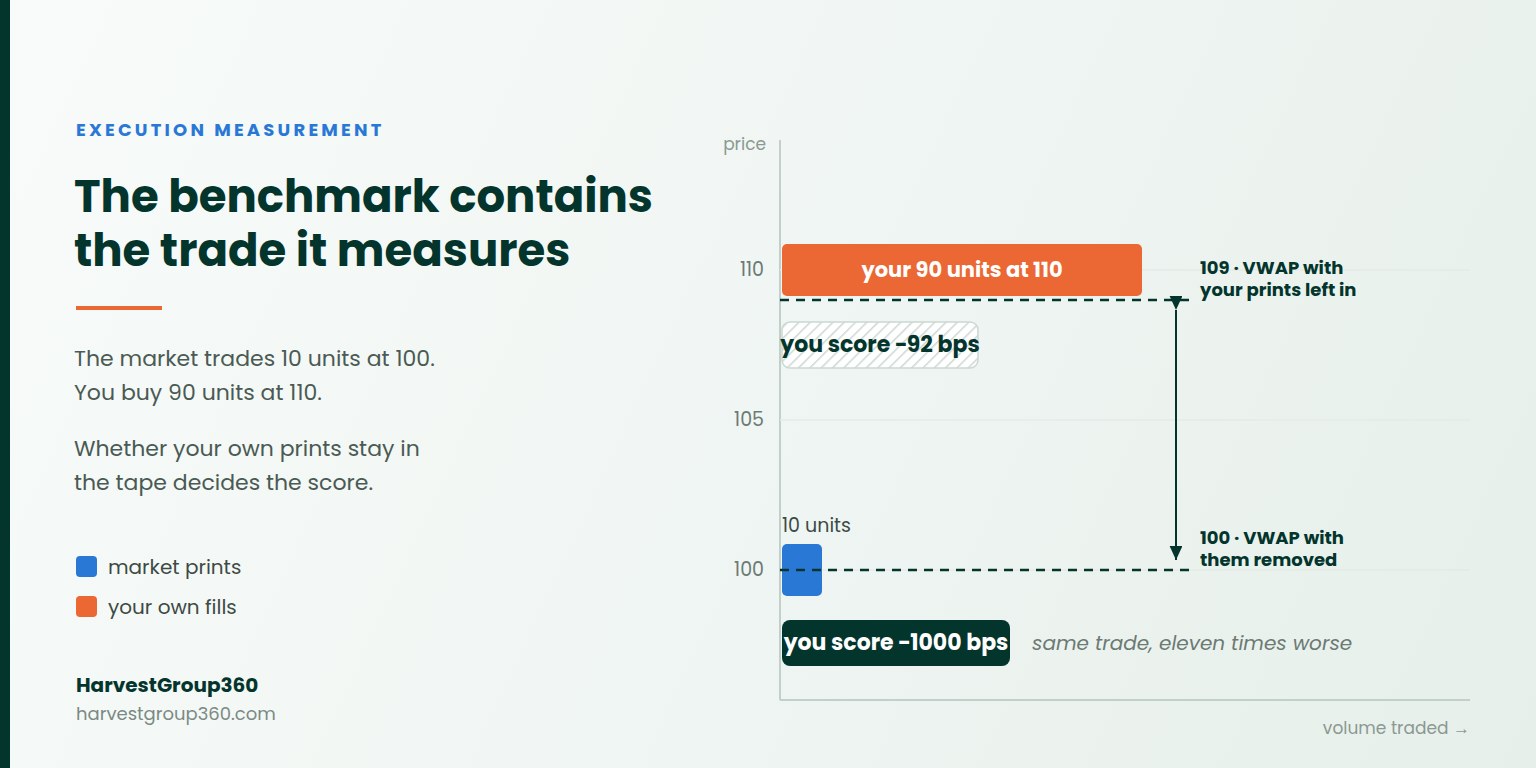
Consider a window in which the market trades ten units at 100 and you buy ninety units at 110. Computed over the full tape, VWAP is 109, and against it your average price of 110 scores -92 basis points — a poor execution, but a survivable one. Remove your own prints and the market VWAP is 100, and the same trade scores -1000 basis points. Nothing about the execution changed. The only thing that changed is whether the benchmark was allowed to contain the thing it was measuring.
One number is eleven times kinder than the other, and the kind one is the wrong one. Both are printed by our own library on the same inputs, and the difference is a single argument.
The size of the effect scales with your share of volume. A desk trading a fraction of a percent of the tape is barely affected. A desk trading a third of it is measuring, in substantial part, its own footprint and reporting it as performance.
Removing your own prints from a public tape is not free. A public tape carries no identity: it says a trade of this size happened at this price at this time, and it does not say who did it. Matching your fills against it — same price, same size, timestamp within a tolerance — is a heuristic, and a coincidental print can be removed instead of yours.
That is a real error. It is also far smaller than the one it prevents. Removing a stranger's identical print shifts the benchmark by one trade; leaving all of yours in shifts it by your entire participation. Choosing the larger error because the smaller one is inexact is a familiar shape of mistake, and it is worth naming when it appears.
The other reason is simpler. A correction that makes your numbers worse is a hard thing to volunteer, particularly when the numbers are reported upward.
A slippage number on its own is close to uninterpretable, and the missing context is almost always participation: your filled volume as a fraction of everything that traded in the same window.
Beating VWAP by two basis points on a tenth of a percent of volume is a genuine result — you traded inside a market you did not move. The same two basis points on thirty percent of volume is mostly a measurement of your own impact, because at that size the market you are being compared to is substantially a market you created.
These two facts are usually presented in separate sections of an execution report, and sometimes on separate pages. Separating them is precisely how a mediocre execution becomes a good slide. Reported together they constrain each other, which is what a measurement is supposed to do.
VWAP asks whether you traded well inside the window you chose. It weights every price by the size that traded at it, so busy periods dominate the average.
TWAP weights time rather than volume, sampling at fixed intervals. It is the appropriate benchmark for an order deliberately spread evenly across a period, and the wrong one for an order that was meant to follow liquidity. A detail worth insisting on: an interval in which nothing traded should be skipped rather than filled with the previous price. Carrying a stale print forward to keep the series tidy invents data, and inventing data to avoid a gap is the same error we described in back-adjusting for corporate actions.
Implementation shortfall compares your fills against the price when the decision was made. It is the least forgiving of the three because it charges you for the delay before you started, not only for how you behaved once you had. An order that executed beautifully over two hours, having waited three hours to begin, scores well on VWAP and badly on shortfall — and the second number is the one that describes what actually happened to the portfolio.
Sign conventions are the quietest source of disagreement in execution reporting. Positive basis points can mean better than the benchmark or worse than it depending on the desk, and both conventions are defensible. What is not defensible is leaving it implicit. We use positive for better: paying below the benchmark on a buy, selling above it on a sell.
Fills on opposite sides should never be netted into a single score. A number covering both buying and selling has no interpretation, because the same price movement helps one and hurts the other. Refusing to compute it is more useful than producing it — the same principle applied to unclassifiable trades in trade classification, where a null side is worth more than a guess, and to stale columns in point-in-time alignment, where a frozen price is worse than an empty one. The whole set of checks sits together in the pipeline audit.
And the benchmark window itself needs stating. Running from your first fill to your last is right for a worked order and meaningless for a single fill, where the only print in the window is your own. Once it is removed there is no market left to compare against, and the honest output is nothing rather than a score derived from one trade that was yours.
None of this works on a tape you have not already cleaned, which is why execution measurement sits at the end of a chain rather than the beginning of one.
The window has to be expressed in the right session, or a benchmark quietly spans an overnight gap — the problem described in trading sessions and time zones. Prices have to be adjusted for corporate actions, or a split inside the window destroys the average. Where the instrument trades in several places, the comparison needs a consolidated view rather than one venue's opinion of the price, along with the staleness and clock-skew handling that requires. The full path from a raw feed to research-ready data is set out in our market data normalization guide, and the cost of skipping it in the hidden cost of dirty market data.
The rules are short. Remove your own prints before computing any benchmark. Report participation next to the score, always. Write down the sign convention. State the window. Never net opposite sides. And treat a benchmark that cannot get worse as a benchmark that cannot tell you anything.
In our open-source tooling that looks like this:
from mdnorm import Fill, Side, evaluate

report = evaluate(my_fills, market_trades, decision_price=Decimal("100"))

print(report.slippage_vs_vwap_bps)   # positive = better than the market
print(report.participation_rate)     # read the two together, never apart
print(report.own_prints_removed)
Or from the command line, against a tape and a file of your fills:
$ pip install market-data-normalizer
$ mdnorm tca fills.csv --market tape.jsonl --decision-price 100
Your own prints are excluded by default; --keep-own turns that off and is documented as making the score better rather than making it correct. Above ten percent participation the command says so out loud. The wider pipeline this sits on top of — normalization, sessions, corporate actions, order books, trade classification — is described across our engineering notes, and the delivery side in the API documentation.
There is a commercial logic to the alternative, and it deserves stating rather than sneering at. A tool that returns friendlier numbers is easier to sell, easier to present, and nobody has ever been dismissed for shipping a benchmark that says the desk is performing adequately.
But a measurement exists to be acted on, and a number that cannot get worse cannot tell you to change anything. That is the entire argument, and it is the reason our own execution figures look poorer this month than they did last month, on identical trades.
The implementation is public and free to inspect on GitHub and installable from PyPI. If you are building research or execution infrastructure on these foundations, our partnership page is open to independent developers and firms alike.
VWAP is the volume-weighted average price of everything that traded in a chosen window. It is an average of prices rather than a price, which is why it almost never sits on the venue's tick grid and why that tells you a file is derived. As an execution benchmark it asks a simple question: did your average fill price beat the average price the whole market paid over the same period? Buying below VWAP or selling above it counts as a good execution.
Because the public tape includes the trades you just made. When VWAP is computed over the window you were trading in, your own executions are part of the average you are measured against, so you are benchmarking yourself partly against yourself. The distortion is not symmetric: it always improves the score, and the larger your share of volume the more the benchmark bends toward your own average price.
By matching your fills against the public tape — same price, same size, timestamp within a tolerance — and removing one print per fill before computing the average. Matching is a heuristic because a public tape carries no identity, so a coincidental print can be removed instead of yours. That error is far smaller than the one it prevents.
Participation rate is your filled volume as a fraction of total market volume over the same window, including your own trades. It decides whether an execution score means anything: beating VWAP by two basis points on 0.1% of volume is a genuine result, while the same two basis points on 30% of volume mostly measures how much you moved the price yourself.
Implementation shortfall compares your average fill price with the price at the moment the decision to trade was made. It differs from VWAP slippage in what it holds you responsible for: VWAP asks whether you traded well inside the window you chose, while shortfall also charges you for the delay before you started.
VWAP weights every price by the size that traded at it, so busy periods dominate. TWAP weights time instead, sampling the market at fixed intervals and averaging those samples, so a quiet minute counts as much as a busy one. TWAP is the more appropriate benchmark for an order deliberately spread evenly over time.
Whichever one is written down. A common convention, and the one used here, is that positive basis points always mean better than the benchmark: paying below it on a buy, selling above it on a sell. Fills on opposite sides should never be netted into a single score, since one number covering both buying and selling has no interpretation.
Yes. HarvestGroup360 maintains market-data-normalizer, an MIT-licensed Python library that computes VWAP, TWAP, slippage, implementation shortfall and participation rate, and removes your own prints from the tape before the benchmark is calculated. Install it with pip install market-data-normalizer (the import name is mdnorm); it has no runtime dependencies and the source is public at github.com/Harvestgroup360/market-data-normalizer.