
HarvestGroup360
© 2026 HarvestGroup360 — a brand operated by AMII LTD.
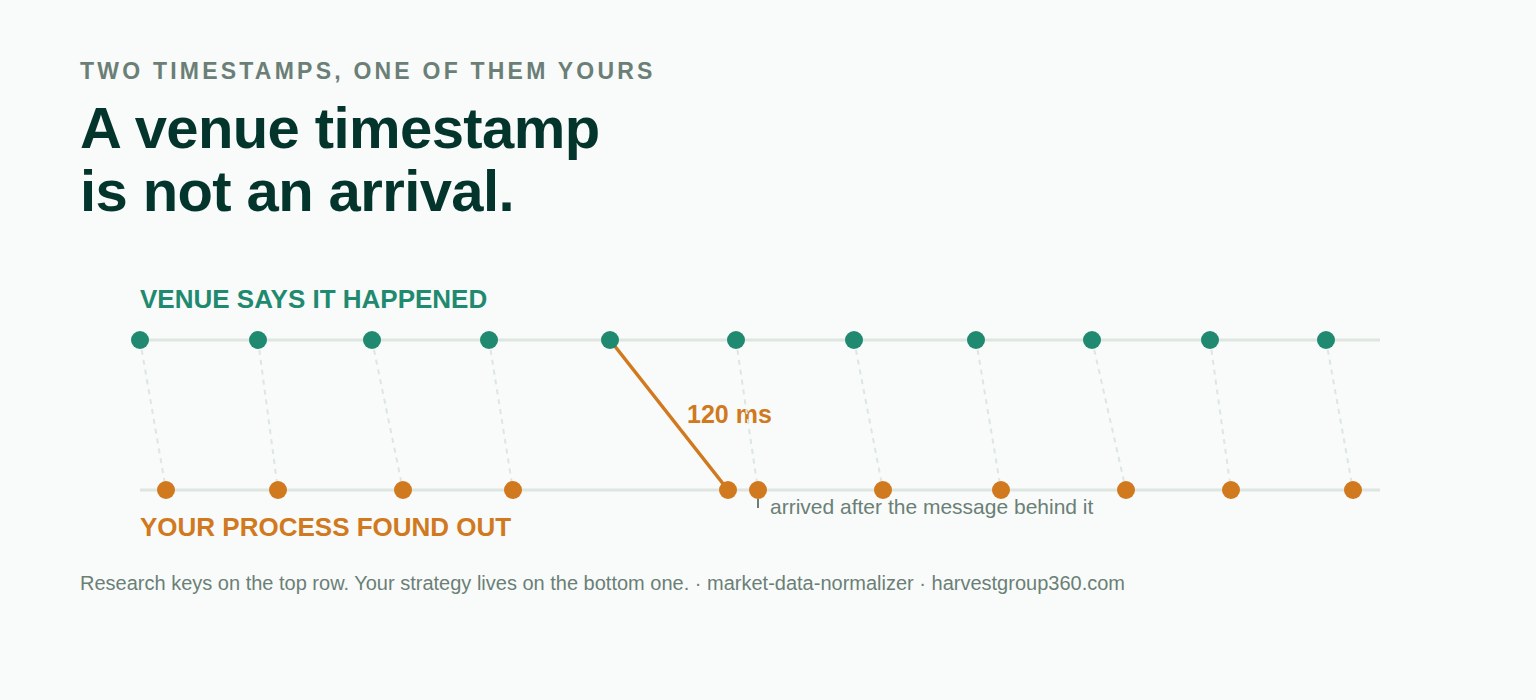
Every observation in a live system has at least two times attached to it: the one the venue wrote, and the one your process read. Research keys on the first. Strategies live on the second.
There is a line in our own library that has been there almost since the beginning. A series can be shifted by a delivery delay, and the documentation for it says, in as many words, that a delay of zero is a claim about your infrastructure rather than a default.
It is good advice. We then shipped no way to follow it. You could model a delay. You could not find out what yours was. This article is about closing that gap, and about what we found when we measured.
A market data event carries a time the venue assigned it. Between that instant and the moment your code can act sits the venue's own publishing path, a network, a transport library, a decoder, and usually a queue. The event exists on both sides of that gap, but it is only knowable on one of them.
Almost every research file we see keys on the venue stamp alone. Often the receipt time was never written down: the capture process had it, used it to order the file, and discarded it. That is the version of this problem that cannot be fixed later, because no analysis can recover a time nobody recorded.
The reason this is worth an article rather than a footnote is the direction of the mistake. Keying on the venue stamp asserts that information reached you instantly, and every consequence of that assertion is flattering:
Signals look actionable earlier than they were. A feature computed at the venue stamp is available, in the backtest, at a moment when the machine running it had not yet been told.
Cross-venue leads are inflated by the difference in transport. If one venue reaches you forty milliseconds faster than another, a lead-lag study keyed on venue stamps is partly measuring your own network map. That is a finding about your rack, not about the market, and it will not survive a change of colocation.
Fills are priced against quotes that had not arrived. The modelled execution takes the best quote at the decision time; the real one could only have taken the best quote the process had.
None of this raises an exception. Nothing in the pipeline fails. The result is simply better than it should be, which is the hardest class of defect there is, because nothing prompts you to go looking. It is the same shape of problem as reading a slow economic series at the period it describes rather than when it was published and choosing an index universe with the benefit of knowing who survived.
The figures below come from one simulated hour of a feed updating about four times a second — 14,717 observations — with a lognormal transport delay and a small fraction of slow retransmissions. It is synthetic on purpose: we would rather show a distribution whose generator we can publish than a client's capture we cannot. The shape is unremarkable; the point is what falls out of it.
| Statistic | Value |
|---|---|
| Observations | 14,717 |
| Minimum delay | 26 µs |
| Median delay | 295 µs |
| 95th percentile | 743 µs |
| Maximum delay | 120 ms |
| p95 / median | 2.52× |
| Arrived out of order | 22 |
Two things in that table are worth pausing on. The p95 is two and a half times the median, which is a well-behaved link. The maximum is four hundred times the median, which is not the same statement at all — it is a handful of retransmissions, and if your staleness window is sized off the typical case it will fire on every one of them.
The obvious summary of a latency distribution is the average, and it is the least useful number available. In the hour above the mean is 588 microseconds against a median of 295 — twice the typical case, because the mean is mostly measuring the tail. It describes neither the normal situation nor the bad one.
It gets worse when the clocks are not in agreement. Take the same hour and make one source's clock three milliseconds fast on fifteen per cent of rows, which is a mild version of something we have seen in real captures:
| Clean feed | One clock 3 ms fast | |
|---|---|---|
| Mean delay | 588 µs | 110 µs |
| Median delay | 295 µs | 259 µs |
| 95th percentile | 743 µs | 715 µs |
| Minimum delay | 26 µs | −2.96 ms |
| Received before sent | 0 | 2,202 (15.4%) |
| Arrived out of order | 22 | 46 |
A team reporting mean latency on that feed would announce an improvement. The median moved by twelve per cent and the p95 barely moved, because rank statistics do not let a minority of impossible values redraw the middle of the distribution. The mean has no such protection.
In that second column, 2,202 rows were received before they happened. That is not physics; it is two clocks disagreeing, and it is extremely common — across venues, across a vendor's own gateways, and inside a single capture host that drifted between synchronisations.
The reflex is to clamp those to zero, and it is the wrong reflex. Clamping does not remove the problem, it removes the evidence: the latency figures still look fine, and the fact that some fraction of your data is stamped on a clock you do not trust disappears from the report. A clock that is wrong on fifteen per cent of messages is not measuring the same thing on the other eighty-five.
The out-of-order count moves too — from 22 to 46 — because skew and genuine overtaking produce the same symptom. Both belong in the report, separately, for the same reason: a pipeline that sorts on receipt without saying how often it had to is hiding the evidence that its sequencing matters at all.
Now the question that decides whether any of this is worth your afternoon. Build both views of the same rows — one keyed at the venue stamp, one keyed at receipt — and ask them the same question at every point of a time grid. Where they answer differently, the optimistic view is holding a value that had not arrived.
| Grid | Points | Views disagree | Share | Largest foresight |
|---|---|---|---|---|
| 1 minute | 60 | 0 | 0.00% | — |
| 10 seconds | 360 | 1 | 0.28% | — |
| 1 second | 3,600 | 16 | 0.44% | 101 ms |
| 100 ms | 36,000 | 125 | 0.35% | 113 ms |
On a one-minute grid the two views are identical at every single point. A daily or minute-bar study on this feed can key on the venue stamp and lose nothing, and anyone who tells that team they have a latency problem is wasting their time.
On a 100-millisecond grid, one point in roughly three hundred shows a price up to 113 milliseconds before the process had it. Whether that matters is not a question about 113 milliseconds. It is a question about what the strategy does with a tick.
This is also why we resisted printing a verdict. A library that decided for you whether 113 milliseconds was acceptable would be making a judgement it has no information to make. It can only put the number next to your horizon and leave the comparison to you.
One design decision is worth stating plainly, because the alternative is so tempting. If a file carries no receipt column, our tooling will not invent one. There is no fallback, no typical value, no assume a millisecond and move on.
You can state an assumption, and the resulting report comes back marked as assumed rather than observed. Those two are not interchangeable, and a report that hides which of them it used is worse than no report, because it will be read as evidence six months later by somebody who was not in the room.
$ mdnorm arrival feed.csv --interval 1s
observations         14717
median delay         295us
p95 delay            743us
max delay            120ms
p95 / median         2.52x
received before sent 0
out of order         22
views disagree at    16 (0.44%)
largest foresight    101ms
This is the same principle as the rest of the library, and it is the reason we ship no default number of trading sessions in a year and no default tick size. A constant that is wrong in a consistent direction is worse than a missing one, because the missing one gets noticed.
All of it is public and none of it asks to be taken on trust. The measurement described here is the arrival module of our open-source library, released in version 1.27.0. It is MIT licensed, has no runtime dependencies, ships 1,058 tests and passes a type checker clean.
pip install market-data-normalizerThe source is on GitHub, the package on PyPI, and the reasoning behind what the library will and will not do is in ROADMAP.md and BENCHMARKS.md beside the code. The longer-form write-ups are on our Medium, release announcements and the conversation around them on LinkedIn, and the tooling we run on our own market data is in the Console.
The engineering notes that go with the other modules are in our blog: a value read before it was published, a universe chosen with hindsight, a trading year that was not 252 sessions, telling real prints from arithmetic and the things we have decided not to build. Public comments on the work, quoted in full with a link to where each was posted, are on the community page, and the team is on the about page.
If something here is wrong, the most useful form to send it in is an issue with a concrete input and a statement of what the right answer would be. We are open to everyone, from independent developers to funds, and a failing test has always been worth more to us than a paragraph that is correct.
A venue timestamp is the moment the exchange or vendor says an event happened. An arrival time is the moment your own process read it. They are separated by everything in between: the venue's own publishing path, the network, your transport library, and any queue your reader sits behind. Research almost always keys on the first one, and every strategy that acts on that research lives on the second.
Because the error is one-directional. Using the venue stamp asserts the information reached you instantly, so every signal appears actionable slightly earlier than it was, every cross-venue lead is inflated by the difference in transport between the two feeds, and a modelled fill is priced against a quote that had not yet reached the machine sending the order. Nothing raises an error. The result is simply better than it should have been.
You need data that carries both stamps — the venue's and your receiver's. If your capture writes only one of them, that is the first thing to fix, because no analysis can recover a time that was never recorded. With both columns present, subtract one from the other per row and look at the distribution rather than a single figure.
A transport distribution has a tail, and the mean mostly measures the tail rather than the typical case. In the hour simulated in this article the mean is twice the median, which describes neither the normal case nor the bad one. Worse, the mean is not robust to clock skew: adding a set of rows from a clock running three milliseconds fast pulled the mean down to 110 microseconds, well below anything the link actually did.
It means the receipt was stamped earlier than the event, which is impossible in physics and common in practice: the two clocks disagree. It is a real property of the setup and usually the more interesting finding, because a clock that is wrong on some messages is not measuring the same thing on the rest. It should be counted and reported, never clamped to zero — clamping converts a clock problem into a latency figure that looks healthy.
Sorting is often the right handling, but it should not be silent. A pipeline that reorders without reporting how often it had to is hiding the evidence that its sequencing matters. In the simulated hour, 22 messages of 14,717 arrived after the message behind them; with a skewed clock on some rows the count doubled.
It depends entirely on the horizon you act on, not on the size of the delay. In the example here, a one-minute grid shows no difference at all between the optimistic and the knowable view, a one-second grid differs at 16 of 3,600 points, and a 100-millisecond grid differs at 125 of 36,000 with a largest unearned foresight of 113 milliseconds. The same feed is irrelevant to a daily rebalance and decisive for a queue position.
Then no tool can invent one, and one that offers a default is telling you something it does not know. The honest move is to state the assumption explicitly and have it recorded as an assumption in the output, so a later reader can tell a measured figure from a believed one. Our library flags such a report as assumed for exactly that reason.