
HarvestGroup360
© 2026 HarvestGroup360 — a brand operated by AMII LTD.
The question we are asked most often this year is what artificial intelligence changes for systematic trading. The honest answer has two halves, and the second one is the one nobody wants.
It would be easy, and wrong, to open with scepticism. Several things really are faster than they were two years ago, and pretending otherwise would cost us the right to be believed about the rest.
Reading an undocumented vendor format used to be an afternoon; it is now a conversation. Translating a paper's notation into working code, which was always the slow part of reproducing anything, has collapsed to minutes. Extracting structure out of filings, transcripts and news — genuinely hard text problems — went from a research project to a library call. Triaging a literature no team has time to read is a real use, and so is generating the unglamorous plumbing that surrounds every strategy: the loaders, the schedulers, the reconciliation scripts.
Those are large gains and they compound. They also share a shape: every one of them is a task where the answer can be checked. The parser either reads the file or it does not. The reproduction either matches the paper's table or it does not. That is the regime where these tools are excellent.
The market has produced one path through history. It will produce one more tomorrow. No quantity of compute creates a second five years of 2019 to 2024, and a model that generates a thousand hypotheses per hour still has to test all of them against the same finite sample.
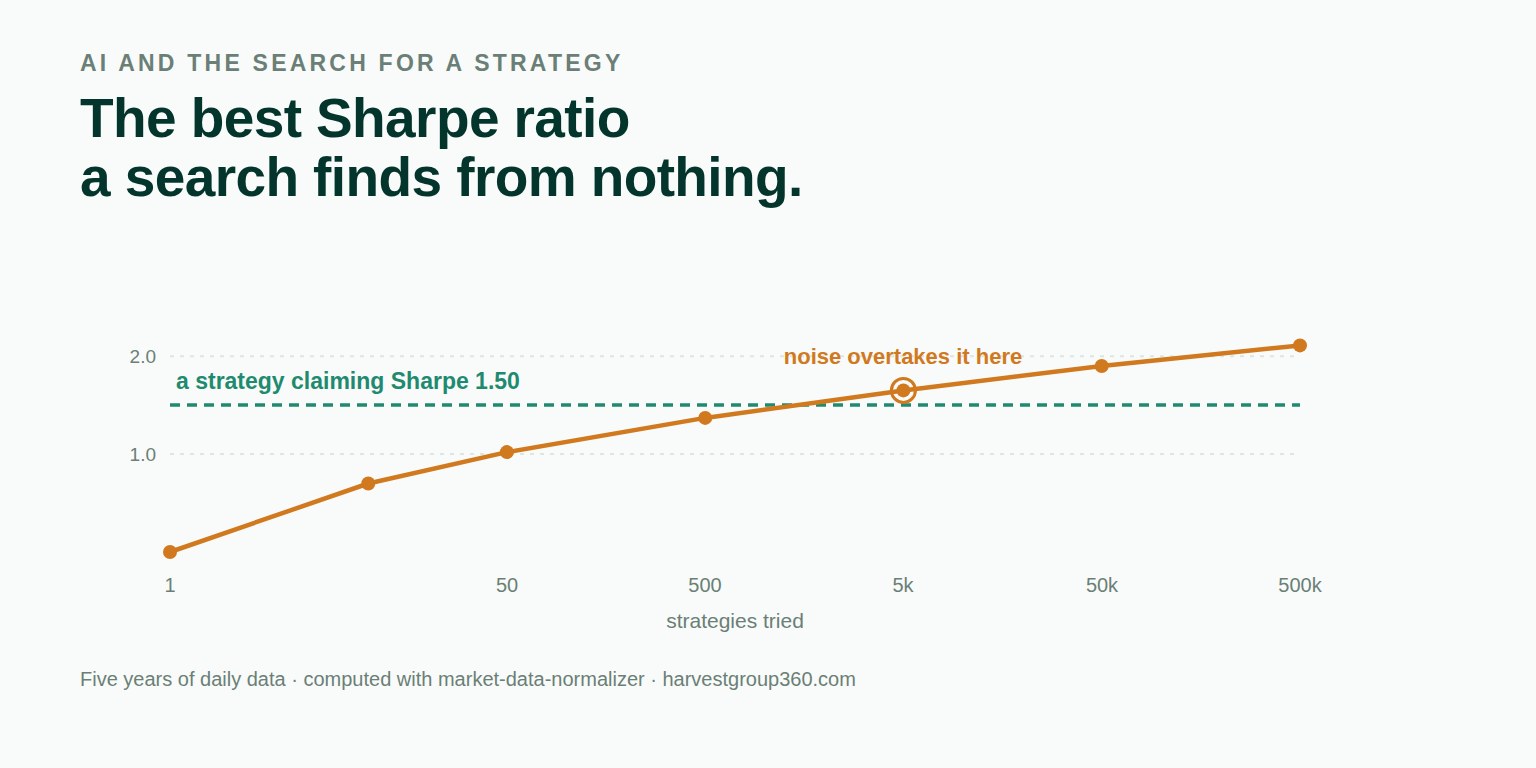
That is the whole difficulty, and it is arithmetic rather than opinion. The best result of a search is a maximum, and the expected maximum of a set of noisy estimates grows with how many you drew. Here is what a search produces on five years of daily data when none of the strategies in it has any edge at all:
| Strategies evaluated | Best annualised Sharpe, from nothing |
|---|---|
| 1 | 0.00 |
| 10 | 0.70 |
| 50 | 1.02 |
| 500 | 1.37 |
| 5,000 | 1.65 |
| 50,000 | 1.90 |
| 500,000 | 2.11 |
expected_max_sharpe from our open-source library, on 1,260 daily observations. Every strategy in that search has a true Sharpe of exactly zero.Read the fifth row again. Five thousand attempts — an afternoon for an automated loop, and not a large number by current standards — is enough to produce an annualised Sharpe of 1.65 out of pure noise. That is a figure most desks would take seriously.
Take one concrete claim and hold everything constant: a strategy showing an annualised Sharpe of 1.50 over five years of daily data. Same strategy, same data, same result. The only thing that varies is how many things were tried before it was found.
| Strategies evaluated | Deflated Sharpe ratio |
|---|---|
| 10 | 0.962 |
| 500 | 0.618 |
| 50,000 | 0.189 |
deflated_sharpe_ratio on the same 1,260 observations.After ten attempts the result is credible. After five hundred it is a coin flip. After fifty thousand it is very probably the best of fifty thousand coin flips, and would be whether or not the strategy made any sense.
Nothing about the strategy moved between those three rows. What moved is an input that most research pipelines never record.
A shorter version of this argument, built around the number of worthless attempts it takes to manufacture each of those figures, is on our Medium.
This is the part that is specifically new, and it is not really about models at all. It is about bookkeeping.
When a person ran a parameter grid, they knew it was a grid and roughly how large. The count was awkward to obtain but obtainable. When a loop generates candidates, evaluates them, discards most within seconds and reports what survived, the count exists only if somebody decided in advance to write it down.
And the count is an input. Every correction for multiple testing — deflated Sharpe, false discovery control, a Bonferroni adjustment, anything — takes the number of trials as an argument. A pipeline that does not log it has not merely lost a statistic. It has made itself impossible to correct, which is a different and worse condition.
There is a second effect, quieter than the first. Generated research code is fluent, idiomatic and plausible, and it makes exactly the mistakes this whole field is prone to — the ones that produce a better result rather than an error message.
Joining to the nearest observation rather than the last one before it. Normalising with means and standard deviations fitted over the whole sample, including its future. Reading a daily figure on the day it describes rather than the day it was published. Keying research on a venue's timestamp as though the information arrived instantly. Removing the shape of the trading day using a curve estimated from months that had not happened yet.
We have written about each of those separately, because each of them cost us something once: a value read before it was published, a universe chosen with hindsight, the delay between a venue stamp and an arrival and a profile fitted on the rest of the year. None of them raises an exception. All of them make the backtest better.
The point is not that a model is careless. It is that fluency and correctness are independent properties, and the review habits most teams have were calibrated on code that looked as rough as it was. Code that reads like a textbook gets less scrutiny than code that reads like a draft, and it should not.
If hypotheses are cheap and evidence is not, then the scarce resource is verification, and the parts of a stack worth investing in are the ones that make a claim checkable rather than the ones that make claims.
That is why everything we have shipped this year is a measurement rather than a model. A join that only looks backwards. A report of how much a full-sample normalisation borrowed from the future. A count of how many trade classifications rest on an ordering the data cannot support. A benchmark computed two ways with the distance between them printed. None of it predicts anything. All of it exists so that a number can be argued with.
There is a companion piece to this one, published today, on a related and even more basic version of the same problem: how many independent observations a dataset actually contains. A thousand rows of a five-day label carry about two hundred, and every t-statistic computed on the thousand is overstated by a factor of 2.2 before any question of overfitting arises.
Not the number of backtests that finished — every configuration the search touched. It costs an integer and it is the difference between a result that can be defended and one that cannot be assessed at all. If the number is embarrassing, that is information too.
A sophisticated model on a dataset that quietly contains its own future is a well-engineered way of measuring nothing. The order matters: fix what the data knew and when it knew it, then worry about the model. This is unglamorous, it is where the errors actually live, and it is the reason our library exists.
Both tables above were computed with the metrics module of our open-source library, using expected_max_sharpe and deflated_sharpe_ratio. It is MIT licensed, has no runtime dependencies and ships 1,237 tests.
pip install market-data-normalizerThe source is on GitHub and the package on PyPI. What the library will and will not do, with the reasoning recorded next to each entry, is in ROADMAP.md. The companion piece to this article is Forty-Six on Medium, and the rest of the long-form writing is there too, releases and the discussion around them on LinkedIn, and the tooling we run against our own market data is in the Console.
The rest of the series is in our blog, public comments on the work are quoted in full with a link to each source on the community page, and the team is on the about page. Newer in the same series: twelve defensible pipelines and one published number.
We are open to everyone, from independent developers to funds. If something here is wrong, an issue with a concrete input and a statement of the right answer is the most useful form to send it in — that has always been worth more to us than a paragraph that is correct.
In specific and real ways, yes. Reading a vendor's undocumented file format, translating a paper's notation into working code, extracting structure from filings and news, triaging a literature nobody has time to read, and writing the plumbing that surrounds a strategy are all genuinely faster than they were. Those are large gains and it would be silly to pretend otherwise. What has not improved is the evidence: the market still produces one path through history, and no amount of compute creates a second one.
Because the best result of a search is a maximum, and a maximum drawn from noise grows with the size of the search. On five years of daily data, a set of variants with no edge whatsoever produces a best annualised Sharpe of about 0.70 after ten attempts, 1.37 after five hundred and 1.90 after fifty thousand. None of those strategies is real. The number is a property of the search, not of the market.
The probability that a result is better than what the search itself would have produced by chance, rather than better than zero. It takes the observed ratio, the sample length and the number of trials, and returns a figure near one when the result stands up and near zero when it is indistinguishable from the best of that many coin flips. The headline Sharpe can be large in both cases, which is the point of computing it.
All of them, including the configurations abandoned after a few seconds, the feature sets discarded before a backtest ran, and every variant an automated loop evaluated overnight. Those are what made the surviving maximum a maximum. A count that includes only the runs somebody wrote down understates the search, and understating the search is the same as inflating the result.
When a person ran a grid, they knew it was a grid and roughly how big. When an agent iterates on its own, discarding as it goes, nothing necessarily records how many hypotheses were touched. The correction for multiple testing takes that count as an input, so a pipeline that does not log it has made itself impossible to correct.
It makes the familiar ones fluently. Joining to the nearest observation instead of the last one before it, normalising with statistics fitted over the whole sample, reading a daily figure on the day it describes rather than the day it was published — these are exactly the errors that produce a better result rather than an error message, and code that reads well is not therefore correct. Fluency and correctness are independent properties.
No, and that is not the argument. The argument is about what carries the burden of proof. A model that generates a hypothesis is doing useful work; a model whose output is accepted because it looks convincing has moved the burden onto nobody. The parts of the pipeline worth investing in now are the ones that make a claim checkable — point-in-time data, honest sample counts, an auditable trial count.
Log the trial count, and make the data layer point-in-time before anything else. Those two are unglamorous and they decide whether everything downstream means anything. A sophisticated model on a dataset that quietly contains its own future is a well-engineered way of measuring nothing.