
HarvestGroup360
© 2026 HarvestGroup360 — a brand operated by AMII LTD.
Four periods: up fifty per cent, down forty, up fifty, down forty. The average is a gain of five per cent a period. The account is down nineteen. Both numbers are correct, and only one of them describes anything that happened.
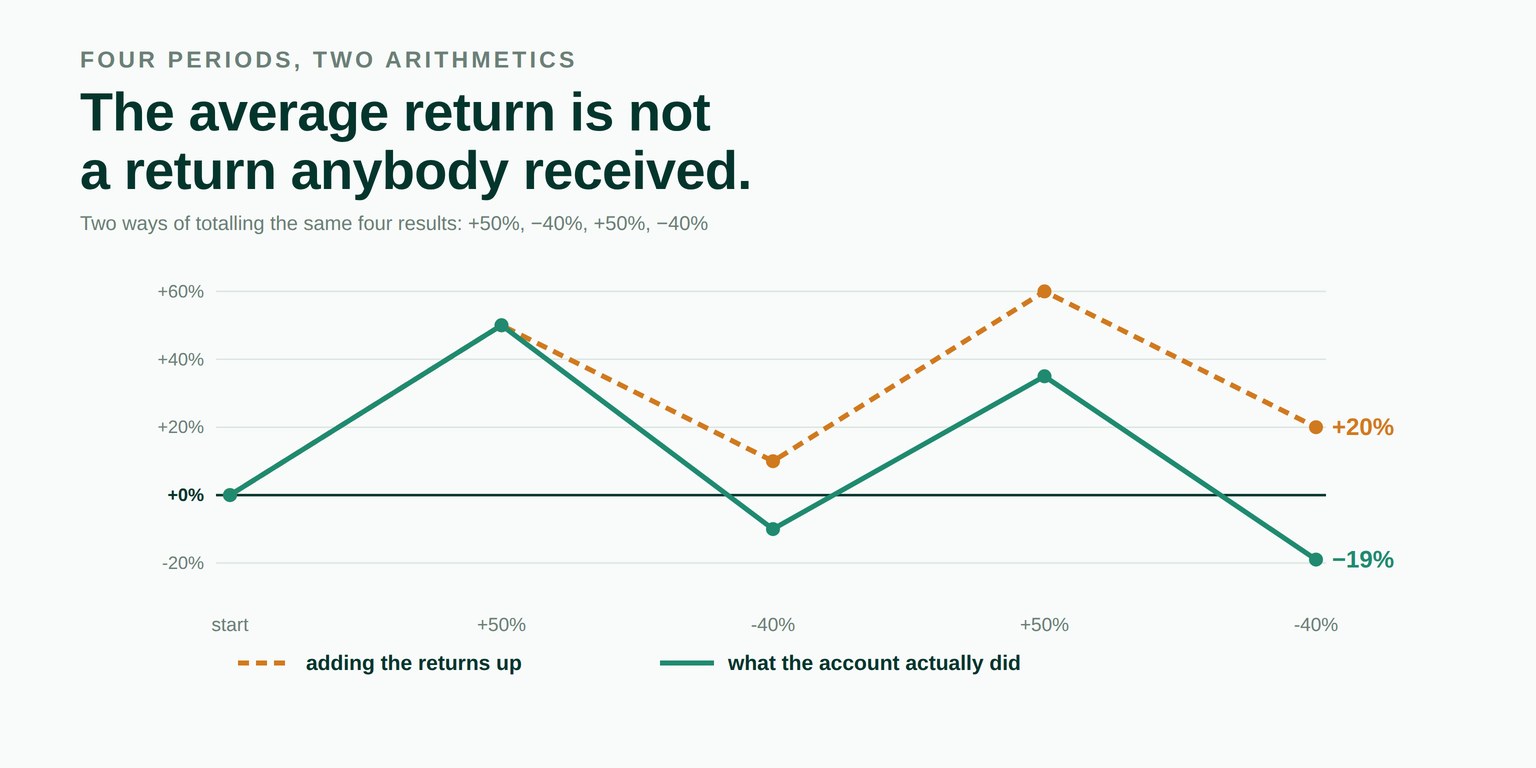
This is the oldest error in the collection and the one most likely to be waved away as a curiosity. It is not a curiosity. It is arithmetic that runs in one direction, it gets larger as a strategy gets more volatile, and it appears in the numerator of most performance figures that are reported on a per-period basis and then scaled up.
The mechanism is that losses and gains are not symmetric in an account. A forty per cent loss takes sixty-seven per cent to recover, not forty. Averaging the percentages ignores the fact that each one applies to a different amount of money.
The four-period example above is chosen for clarity, and it is fair to object that no real strategy swings that hard. So here is a perfectly ordinary twelve-month series — twelve monthly returns, none of them extreme, printed in full so anyone can check every figure that follows:
+5.0%  -3.0%  +4.0%  +2.0%  -2.0%  +6.0%
-4.0% +3.0% +1.0% +2.0% -1.0% -1.0%| Quantity | Value | |
|---|---|---|
| Arithmetic mean | 1.0000% | what gets reported |
| Geometric mean | 0.9529% | the rate that actually compounds to the total |
| Variance drag | 0.0471% | the difference, per month |
| Approximation, half the variance | 0.0475% | close here; not always |
| Monthly volatility | 3.0822% |
Five basis points a month sounds negligible, and month by month it is. It is when the figure gets annualised that it stops being negligible, because annualising is where the two arithmetics diverge and where almost every report performs the operation incorrectly.
Take the arithmetic mean of 1.00 per cent a month and compound it out for twelve months, which is what a spreadsheet does. Then take what the account actually did over those same twelve months:
| Method | Annual return | |
|---|---|---|
| Compounding the arithmetic mean | 12.6825% | what the report says |
| What the series actually returned | 12.0539% | what the account shows |
| Overstatement | 0.6286% | 5.22% of the return |
Sixty-three basis points a year, on an ordinary series, from an operation that looks like it cannot be wrong. On a book of any size that is a real number, and it is reported every year, in the same direction, by construction.
The module originally called the gap between the sum of the returns and the compounded total “the overstatement”, on the assumption that adding returns up always flatters. It does not. Compounding adds the cross-products of the returns, and those can be positive or negative:
| Series | Sum of returns | Compounded total | Gap |
|---|---|---|---|
| The twelve months above | +12.0000% | +12.0539% | +0.0539% |
| +50%, −40%, +50%, −40% | +20.0000% | −19.0000% | −39.0000% |
It is now called total_gap, with no claim about its direction, and the comparison that does have a guaranteed direction — the annualised one — is what carries the word overstatement. The correction is in the changelog with the version it landed in. We would rather publish the fix than quietly improve the docstring, on the grounds that a library whose argument is that flattering errors do not announce themselves is in no position to hide its own.
This is where the effect stops being a rounding concern. The drag depends on the variance of the returns, and scaling a position by a multiple scales the variance by the square of that multiple. The expected return scales linearly. The two do not stay in proportion:
| Leverage | Monthly drag | Relative to unlevered |
|---|---|---|
| 1× | 0.0471% | 1.00× |
| 2× | 0.1869% | 3.97× |
| 3× | 0.4177% | 8.87× |
| 4× | 0.7387% | 15.69× |
Because return grows linearly and drag grows quadratically, there is always a multiple beyond which additional leverage lowers the compounded result rather than raising it. Where that point sits depends entirely on the series, and this module does not compute it, because doing so would require assuming the future volatility equals the measured one — which is exactly the assumption that makes levered products behave unlike their brochures.
from decimal import Decimal
from mdnorm.compounding import Convention, compound_report

rep = compound_report(monthly, convention=Convention.SIMPLE)

rep.arithmetic          # 0.010000
rep.geometric           # 0.009529
rep.drag                # 0.000471
rep.approximate_drag    # 0.000475
rep.volatility          # 0.030822
rep.total_gap           # 0.000539   <- no fixed sign

year = rep.annualised(periods_per_year=12)
year.naive              # 0.126825
year.actual             # 0.120539
year.overstatement      # 0.006286   <- this one has a fixed sign
year.overstatement_share  # 0.0522
Every figure is computed in exact decimal arithmetic rather than floating point. That is not decoration: the whole subject of this article is a difference in the fourth decimal place that matters, and computing it in binary floating point would introduce an error of the same order as the quantity being measured.
Both conventions are supported and neither is a default. The caller states whether a series is simple or log, and if a log series is passed in as simple the error message for an impossible return names the other convention, because that is almost always what happened.
It is the better number for describing what an account did. The arithmetic mean is the right one for an expectation of a single future period, and substituting the geometric mean there produces a different error in the opposite direction. Both are reported because both are correct answers to different questions, and the failure this module addresses is using one where the other belongs.
Every figure here comes from the realised series. Applying a measured drag to a future period assumes the volatility repeats, which is precisely the assumption that a window sweep exists to test. The library reports what the past series did and does not extrapolate it.
A strategy that compounds at 12.05 per cent instead of 12.68 is still compounding at 12.05 per cent. The point is the gap between the figure that gets published and the figure that arrives in the account, not the merit of what produced either. As everywhere else in this library, the job is to report and not to judge.
It looks like a finance question rather than a normalisation one. It ends up here for the same reason every other module does: it is a way for a research pipeline to produce a number that is wrong in a direction that flatters, and that class of error does not announce itself.
It is the same shape as counting forty positions as forty bets, as a Sharpe ratio that cannot be anything but zero, and as treating overlapping labels as independent observations. Each of them produces a plausible figure by a defensible route, each errs upward, and none of them raises an exception.
Every figure above came from the compounding module of our open-source library, released in version 1.41.0. Unlike most articles in this series the input is not a random draw — the twelve monthly returns are printed in full above, so every number here can be recomputed by hand, in a spreadsheet, or by any other library, and we would rather you did. MIT licensed, no runtime dependencies, 1,608 tests, type-checked clean.
pip install market-data-normalizerThe source is on GitHub, the package on PyPI, and the reasoning behind what the library will and will not do is in ROADMAP.md beside the code. Longer write-ups are on our Medium, releases on LinkedIn, and the tooling we run against our own data is in the Console.
The rest of the series is in our blog: the Sharpe ratio of a residual, why forty positions is not forty bets, twelve defensible pipelines and one published number, the start date somebody chose and the things we have decided not to build. Public comments on the work are quoted in full with a link to each source on the community page, and the team is on the about page.
We are open to everyone, from independent developers to funds. If something here is wrong, an issue with a concrete input and a statement of what the right answer would be is the most useful form to send it in — a failing test has always been worth more to us than a paragraph that is correct.
The difference between the arithmetic mean of a return series and the rate that actually compounds to the series total. It is never negative: the geometric mean is at most the arithmetic mean for any set of returns, with equality only when every return is identical. The gap grows with the dispersion of the returns, so the more volatile a strategy is, the more its average flatters it.
It is close for small returns and drifts for large ones. On a series with a one per cent standard deviation the exact drag and the approximation agree to within a per cent of each other; at twenty per cent they disagree by more than three per cent. The library reports both figures side by side so the reader can see how far apart they are on their own data, rather than picking one.
No, and an earlier draft of this module said it did. Compounding adds the cross-products of the returns, and their sign is not fixed. A steadily positive series compounds to more than the sum of its returns; a volatile series that swings can compound to far less. On the four periods in this article the sum says plus twenty per cent and the account is down nineteen.
Annualising. Multiplying a per-period mean by the number of periods always gives at least what the series actually compounds to over the year, because it drops both the compounding and the drag. That is why the library reports the annualised comparison as the overstatement and gives the sum-versus-total figure a neutral name.
Because the drag scales with variance, and variance scales with the square of the multiple. Doubling the size of a position roughly quadruples the drag; tripling it multiplies the drag by about nine. In the series below the measured factors are 3.97 and 8.87. The expected return scales linearly and the drag scales quadratically, so there is always a multiple past which more leverage lowers the compounded result.
Both conventions, and neither is a default. A caller states whether a series is simple or log, and the same report comes back either way, computed correctly for that convention. This matters because a log series fed in as simple looks like a series with impossible losses — the error message for a return below minus one names the other convention, because that is usually what happened.
The compounding module of our open-source library, released in version 1.41.0. The monthly series is printed in full in the article, so every figure can be recomputed by hand or by any other tool. MIT licensed, no runtime dependencies, 1,608 tests, type-checked clean.