
HarvestGroup360
© 2026 HarvestGroup360 — a brand operated by AMII LTD.
A book of forty names, held in size, rebalanced monthly, run by somebody competent. Its average pairwise correlation is 0.486, which makes it about three and a half independent bets. Every risk report it produces says forty.
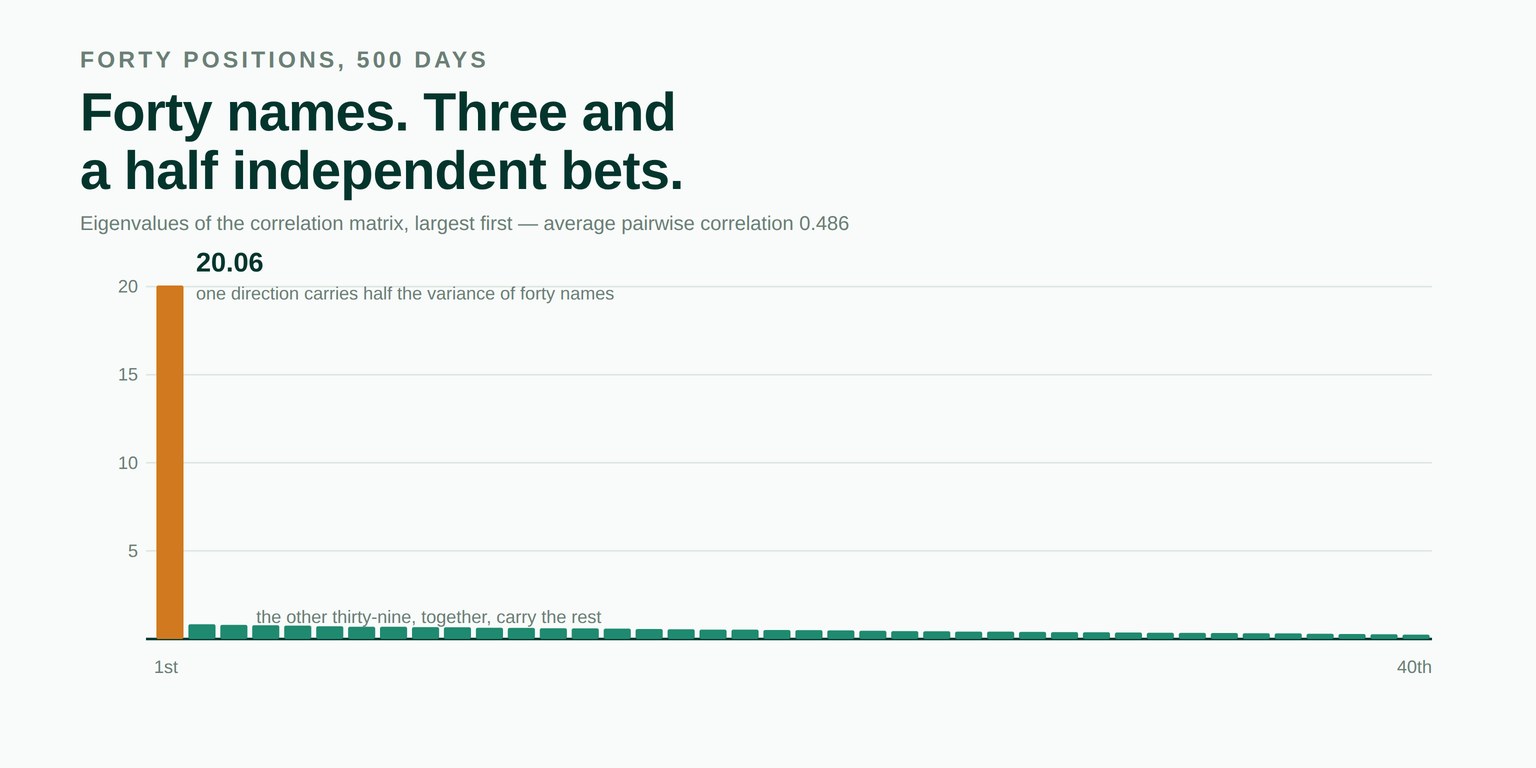
Diversification gets counted and not measured. The count is easy, available immediately, and appears on every sheet: forty positions, twelve sectors, three regions. The measurement requires a correlation matrix and a decomposition, and it tends to produce a number nobody enjoys.
The gap between the two is not a rounding difference. In an ordinary long book it is an order of magnitude, and it runs in the direction that flatters — which is the property shared by every error this library exists to catch.
Take forty series over 500 days, each driven by a common market factor with a loading between 0.6 and 1.0, plus its own idiosyncratic noise. This is not an adversarial construction. It is what a long book of liquid equities looks like.
| Quantity | Value | What it means |
|---|---|---|
| Positions | 40 | what the risk report says |
| Average pairwise correlation | 0.4856 | the typical pair moves together about half the time |
| Largest eigenvalue | 20.0646 | one direction carries 50.2% of the total variance |
| Effective number of bets | 3.8666 | how many independent directions the book spans |
| Effective observations | 2.0061 | how much independent information a cross-sectional average carries |
| Overstatement | 10.34× | positions divided by bets |
| Ratio overstatement | 3.22× | the square root — what it does to a standard error |
The second eigenvalue is 0.84. The fortieth is 0.25. Between the first direction and everything else there is a factor of twenty-four, and the thirty-nine remaining directions between them account for less than half of what the book does.
This module reports two numbers, and the reason they are both there is that an earlier draft of it treated them as interchangeable. They are not. They answer different questions:
| Measure | Computed from | Answers |
|---|---|---|
| Effective number of bets | the spread of the eigenvalues | how many independent directions the cross-section spans |
| Effective observations | the average pairwise correlation | how much independent information a cross-sectional average carries |
The distinction matters when the number gets used. If the question is how concentrated the risk is, the bet count is the right one. If the question is whether a cross-sectional average is significant, the observation count is, because that is the one that belongs in a standard error. Using the larger of the two because it is more comfortable is the error the two-number report exists to prevent.
A cross-sectional result — a factor spread, a signal's average return across names, a sector tilt — arrives with a t statistic computed on forty observations. Those forty observations are the forty names, and they are correlated at 0.486.
| Sample treated as | Effective size | t statistic |
|---|---|---|
| Forty independent names | 40 | 3.10 |
| What the correlation implies | 2.01 | 0.69 |
A t of 3.10 is a finding. A t of 0.69 is not. Nothing between the two rows is a judgement call: the correlation matrix was estimated from the same data that produced the statistic, and the deflation is arithmetic.
This is the same structure as overlapping labels inflating a t statistic in the time dimension. There the sample was fewer observations than the row count suggested because the rows overlapped in time. Here it is fewer because the columns overlap in what drives them. Both produce a denominator that is too small, and neither announces itself.
The matrix can be supplied directly or built from aligned return series. The report carries both counts, the sample size and two flags:
from mdnorm.breadth import correlation_matrix, breadth_report

rep = breadth_report(correlation_matrix(returns_by_name))

rep.names                    # 40
rep.observations             # 500
rep.average_correlation      # 0.4856
rep.effective_bets           # 3.8666
rep.effective_observations   # 2.0061
rep.overstatement            # 10.34
rep.ratio_overstatement      # 3.22
rep.thin_sample              # False

# and the count goes straight into a deflated t statistic
from mdnorm.independence import deflate_t_stat
deflate_t_stat(Decimal("3.10"), rep.as_sample())   # 0.6942
The eigenvalues come from a cyclic Jacobi decomposition carried out in exact decimal arithmetic rather than floating point, because a correlation matrix that is nearly singular is exactly the case where floating point stops being trustworthy and a book with two near-identical names is nearly singular by construction.
That decomposition taught us something worth recording. The solver originally stopped when the off-diagonal mass fell below a fixed threshold, which is the obvious rule and the wrong one: at forty names and forty digits of precision the mass stalls at around 1.9×10⁻²³ and never goes lower, because that is the round-off floor rather than a failure to converge. The solver now stops when the mass stops shrinking, and raises only if the floor it settles at is too high to trust.
Forty names produce 780 pairwise correlations, and 500 observations is not a lot of data for 780 numbers. The estimate is noisy, the noise biases the eigenvalue spread upward, and the effective count is therefore somewhat optimistic rather than pessimistic. The report flags a thin sample — fewer observations than names squared over two — and does not correct for it, because every correction we know of requires an assumption about the true structure that the caller, not the library, should be making.
Pairwise linear correlation misses tail dependence entirely. Two names that are uncorrelated in ordinary weeks and fall together in a crisis will show a comfortable number here and behave like one position when it matters. Nothing in this module addresses that, and a low average correlation should not be read as a claim about a drawdown.
A book with genuine breadth and no edge loses money slowly instead of quickly. The effective count says how many independent opportunities are being taken, not whether any of them is worth taking. It is a denominator, and a denominator improves nothing on its own.
There is no built-in level at which an average correlation counts as high, no number of bets below which a book is called concentrated, and no rule about when a sample is too thin to use. The two flags the report does carry are computed from conditions the caller can read in the source, not from judgements about what is acceptable.
This is the same refusal that runs through the library: it will not pick a cell out of a specification grid, it will not choose where a sample begins, and it will not decide that 3.87 bets is too few. A threshold chosen inside a library makes the answer partly a property of the library, and the person reading the result has no way of knowing which part.
Every figure above came from the breadth module of our open-source library, released in version 1.39.0, run against the deflation implementation in the same package. The panel is a seeded pseudo-random draw — forty series of 500 observations from random.Random(20260913), each a loading between 0.6 and 1.0 on one common factor plus gauss(0, 0.8) of its own — so the correlation matrix, the full eigenvalue spectrum and both counts reproduce exactly on any machine. MIT licensed, no runtime dependencies, 1,608 tests, type-checked clean.
pip install market-data-normalizerThe source is on GitHub, the package on PyPI, and the reasoning behind what the library will and will not do is in ROADMAP.md beside the code. Longer write-ups are on our Medium, releases on LinkedIn, and the tooling we run against our own data is in the Console.
The rest of the series is in our blog: twelve defensible pipelines and one published number, the start date somebody chose, the file that did not change while the answer did, a thousand rows and two hundred observations and the things we have decided not to build. Public comments on the work are quoted in full with a link to each source on the community page, and the team is on the about page.
We are open to everyone, from independent developers to funds. If something here is wrong, an issue with a concrete input and a statement of what the right answer would be is the most useful form to send it in — a failing test has always been worth more to us than a paragraph that is correct.
A count of how many independent directions a cross-section actually spans, computed from the eigenvalues of its correlation matrix rather than from the number of positions. Forty uncorrelated names give forty bets. Forty names that all move together give one. Real books sit between, usually much closer to one than the position count suggests.
Because they answer different questions and they are not interchangeable. The effective number of bets, from the spread of the eigenvalues, says how many independent directions the book spans. The effective number of observations, from the average pairwise correlation, says how much independent information a cross-sectional average carries. Three names at correlation 0.5 give two bets and one and a half observations. Reporting one as the other would understate or overstate depending on which way round the mistake went, so we report both and label them.
No. A book concentrated in one sector is supposed to have low breadth, and a manager who intends that has not made a mistake. What the number rules out is claiming the diversification of forty positions while holding the breadth of four. The measure reports; it does not judge.
A cross-sectional t statistic computed as though forty names were forty independent observations is computed on a sample that does not exist. Substituting the effective count deflates it by the square root of the ratio. In the case below a t of 3.10 becomes 0.69, which is the difference between a result and nothing.
It is enough for the closed-form effective-observation count and not enough for anything else. Two books with the same average correlation can have very different eigenvalue spectra — one broadly coupled, one with a single dominant factor and otherwise unrelated names — and they behave differently in a drawdown. That is why the eigenvalues are reported rather than summarised away.
A correlation matrix estimated from fewer observations than it has entries is noise with a shape. The report flags a thin sample rather than correcting for it, because the correction depends on assumptions the library does not want to make on a caller's behalf. Flagged and uncorrected is the honest state.
The breadth module of our open-source library, released in version 1.39.0. The panel is a seeded pseudo-random draw stated in the article, so the correlation matrix, the eigenvalues and both counts reproduce exactly on any machine. MIT licensed, no runtime dependencies, 1,608 tests, type-checked clean.