
HarvestGroup360
© 2026 HarvestGroup360 — a brand operated by AMII LTD.
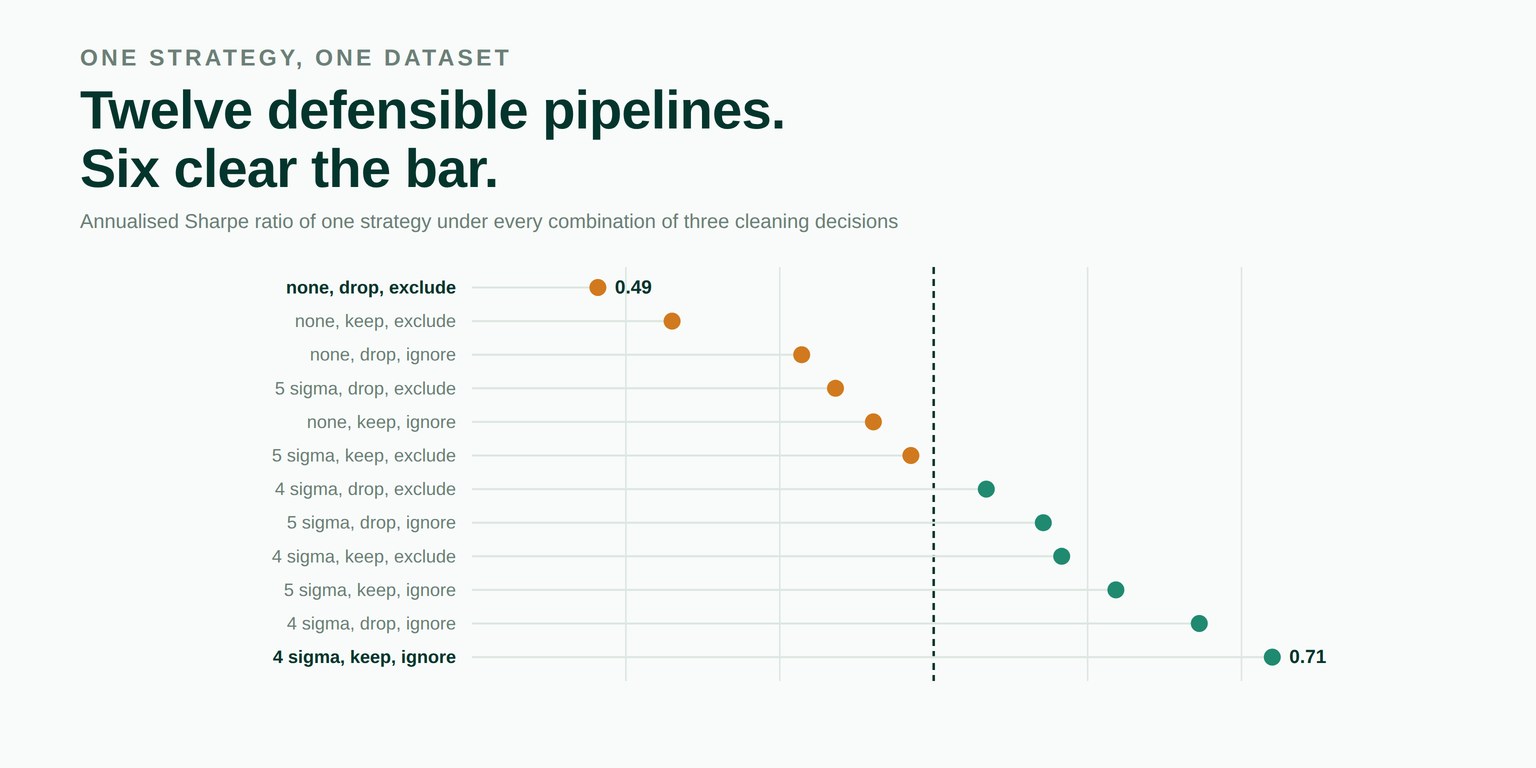
Three decisions taken during cleaning, none of them controversial, turn one backtest into twelve. The results run from an annualised Sharpe of 0.49 to 0.71, and which of them gets written down depends on choices made before anyone looked at the answer.
A research result arrives as one number produced by one pipeline. The number gets argued about. The pipeline does not, because by the time the number exists the pipeline has become furniture — somebody wrote it months ago, the decisions inside it were each defensible when they were made, and nobody has a reason to go back and ask what the answer would have been under the other option.
There is usually no single moment where the pipeline went wrong. That is the difficulty. A dozen reasonable choices compound into a grid, and the published figure is one cell of that grid, chosen by history rather than by argument.
Take 1,008 daily returns — four years — from a strategy with a handful of genuine outlier days, a stretch of repeated prints from a thinly quoted period, and seven days that appear in the venue's halts file. Three decisions have to be made before a Sharpe ratio exists:
| Decision | Options | Why each is defensible |
|---|---|---|
| Clip extremes | none · 5σ · 4σ | Leaving them in respects the data; clipping stops one print dominating the variance |
| Stale prints | keep · drop | A repeated price may be a real unchanged close or a feed that stopped updating |
| Halts file | ignore · exclude | A halted day is not a tradeable day, but the file is itself a vendor product with its own errors |
Running the identical analysis in all twelve cells gives twelve annualised Sharpe ratios:
| Specification | Annualised Sharpe | |
|---|---|---|
| clip none, drop stale, exclude halts | 0.4909 | lowest |
| clip none, keep stale, exclude halts | 0.5150 | |
| clip none, drop stale, ignore halts | 0.5571 | |
| clip 5σ, drop stale, exclude halts | 0.5681 | |
| clip none, keep stale, ignore halts | 0.5804 | |
| clip 5σ, keep stale, exclude halts | 0.5926 | |
| clip 4σ, drop stale, exclude halts | 0.6171 | |
| clip 5σ, drop stale, ignore halts | 0.6356 | |
| clip 4σ, keep stale, exclude halts | 0.6416 | |
| clip 5σ, keep stale, ignore halts | 0.6592 | |
| clip 4σ, drop stale, ignore halts | 0.6863 | |
| clip 4σ, keep stale, ignore halts | 0.7100 | highest |
Suppose the desk requires 0.60 before a strategy goes to the next stage. Six of the twelve pipelines clear it and six do not. Nothing about the strategy differs between those two groups.
The useful output is rarely the number is unstable. It is usually the number is a function of one specific choice, and that is answerable. Holding nothing else fixed, the median result under each option of each decision:
| Decision | Option medians | Range |
|---|---|---|
| Clip extremes | none 0.5361 · 5σ 0.6141 · 4σ 0.6640 | 0.1279 |
| Halts file | ignore 0.6474 · exclude 0.5803 | 0.0670 |
| Stale prints | keep 0.6171 · drop 0.5926 | 0.0245 |
The clipping threshold moves the answer by five times as much as the stale-price rule. This is not a surprise once stated — clipping acts on the handful of days that dominate the variance, while the other two decisions remove days that were mostly unremarkable — but it is worth saying out loud, because the clipping threshold is the one of the three that was never discussed. Four sigma got written into the pipeline because four sigma is what people write.
A sentence that a reviewer can act on looks like this: the reported Sharpe of 0.71 falls to 0.54 if extremes are not clipped, and the clipping threshold was chosen before the data was seen. That is a different conversation from the Sharpe is 0.71.
A grid of twelve produces twelve candidate answers, and picking the best of them is a search. The same logic that applies to a moved start date applies here, so the specification count can be handed to a deflated Sharpe ratio:
| Best cell (annualised 0.7100) | Probabilistic / deflated | Reading |
|---|---|---|
| Treated as the only pipeline | 0.9217 | strong |
| Deflated against 12 specifications | 0.8842 | weaker, still strong |
The correction here is modest, and we would rather explain why than let it look more impressive than it is. The twelve cells are tightly clustered, so the variance across trials is small, and a deflation driven by that variance cannot take much away. A grid whose cells disagreed violently would cost far more.
The caller supplies the grid and the function that turns a specification into a number. The library enumerates, runs and summarises:
from decimal import Decimal
from mdnorm import Choice, specifications, explore
from mdnorm.multiverse import choice_effect, dominant_choice

choices = [
    Choice("clip",  [("none", None), ("5 sigma", Decimal(5)),
                     ("4 sigma", Decimal(4))]),
    Choice("stale", [("keep", False), ("drop", True)]),
    Choice("halts", [("ignore", False), ("exclude", True)]),
]

curve = explore(specifications(choices), run_pipeline)

curve.trials             # 12
curve.lowest             # 0.4909
curve.highest            # 0.7100
curve.median             # 0.6048
curve.spread             # 0.2191
curve.changes_sign       # False

dominant_choice(curve).name          # 'clip'
choice_effect(curve, "clip").spread  # 0.1279
run_pipeline is yours. It receives a specification, reads the options it cares about, and returns a number or None when that cell cannot be evaluated. Cells that return nothing are counted separately rather than quietly dropped, because a grid in which three pipelines failed is a different object from a grid of nine.
The curve above covers three decisions. The pipeline that produced it contains more — which side of a session boundary an overnight bar belongs to, how a closing auction print is treated, whether a quiet stretch counted as a halt. Leaving a decision out of the grid does not make the result insensitive to it. It makes the sensitivity invisible, which is where it started.
It is a range of point estimates under different processing, and it carries no probability statement whatsoever. Sampling error sits on top of it, unmeasured here. Reporting 0.49 to 0.71 as though it were an interval would be a category error, and a convenient one, so we say plainly that it is not.
The library does not rank specifications, does not average them, and does not suggest that the median is more trustworthy than the extremes. Averaging across a grid would produce a number no pipeline generated, which is a worse object than any of the twelve. Which cell is correct is a question about the market and the data vendor, and it is answered by argument rather than by arithmetic.
There is no default grid in this module, no suggested clipping threshold, and no built-in set of “standard” cleaning options. This is the same refusal that runs through the library: it will not guess how many strategies a search evaluated, it will not decide when overlapping labels stop being independent, and it will not decide which sigma is the sensible one.
A threshold chosen inside a library makes the answer partly a property of the library, and the person reading the result has no way of knowing which part. Requiring the caller to state every option is less convenient by design, and it means the grid ends up somewhere a reviewer can find it — ideally in a run manifest beside the figure it produced.
Every figure above came from the multiverse module of our open-source library, released in version 1.38.0, run against the winsorising and deflated-Sharpe implementations in the same package. The return series is a seeded pseudo-random draw — 1,008 values from random.Random(20260912) at gauss(0.00035, 0.0092), with seven days overwritten as outliers, eleven as repeated prints and seven listed in the halts file — so every cell of the grid reproduces exactly on any machine, including the cells that are inconvenient for us. MIT licensed, no runtime dependencies, 1,608 tests, type-checked clean.
pip install market-data-normalizerThe source is on GitHub, the package on PyPI, and the reasoning behind what the library will and will not do is in ROADMAP.md beside the code. Longer write-ups are on our Medium, releases on LinkedIn, and the tooling we run against our own data is in the Console.
The rest of the series is in our blog: the start date somebody chose, the file that did not change while the answer did, the stop-loss that always fills, the biggest trade of the day that was not a trade and the things we have decided not to build. Public comments on the work are quoted in full with a link to each source on the community page, and the team is on the about page.
We are open to everyone, from independent developers to funds. If something here is wrong, an issue with a concrete input and a statement of what the right answer would be is the most useful form to send it in — a failing test has always been worth more to us than a paragraph that is correct.
Every result comes out of a pipeline, and a pipeline contains decisions that were made once and never revisited. Enumerating the defensible options for each decision gives a grid, and running the same analysis in every cell of that grid gives a curve of answers rather than one answer. The published figure is one cell of it, and until the grid is run nobody knows which cell.
It is a conservative substitute for one. Specifications built from a shared grid are not independent: two pipelines that differ in one choice out of three see almost the same data, so twelve cells did not involve twelve independent searches. Deflating by the raw count overstates how much searching happened, which is the direction to be wrong in, and it is still wrong. Nothing in the library estimates the effective number, because doing so needs a model of how the choices correlate.
It means the result is not a strong function of the decisions in that grid. It says nothing about the decisions left out of the grid, and the grid is supplied by the caller. A curve is a statement about the choices you thought to enumerate.
In our experience it is whichever one touches the largest observations. In the case below the clipping threshold moves the median result by 0.128 of annualised Sharpe, the halts file by 0.067 and the stale-price rule by 0.025 — because clipping changes the handful of days that dominate the variance, and the other two remove days that were mostly unremarkable.
Because picking one is the research question, not a service a tool can provide. A library that chose a clipping threshold would make the answer partly a property of the library, and a reader would have no way of knowing which part. The grid is supplied by the caller, and so is the function that turns a specification into a number.
It can be, if the choices that produce it are stated alongside it and the spread is reported with it. What cannot be done honestly is publishing the highest cell as though the grid were never run. The spread is not noise around the result; on this evidence it is a component of it.
The multiverse module of our open-source library, released in version 1.38.0. The return series is a seeded pseudo-random draw stated in the article, so every cell reproduces exactly on any machine. MIT licensed, no runtime dependencies, 1,608 tests, type-checked clean.