
HarvestGroup360
© 2026 HarvestGroup360 — a brand operated by AMII LTD.
A halted instrument cannot be bought or sold. A backtest reading the same tape does not know that, and the orders it places in the silence are the ones it most wants to have placed.
Yesterday we wrote about a print that arrives on the tape without being a trade. This is the mirror image: a stretch of tape that arrives without being calm. Both are rows that look ordinary and are not, and both are wrong in the direction that flatters.
When an instrument halts, it stops printing. That is the entire signal. There is no field in a trade record that says the market was shut, and there is nothing in a gap between two timestamps that distinguishes a regulatory pause from a slow afternoon.
Most research pipelines then make the gap invisible on purpose. A minute grid, a resampled bar series, an as-of join — all of them carry the last known price forward, because that is the right behaviour almost all of the time. Through a halt it produces thirty-two identical rows that a strategy reads as thirty-two opportunities.
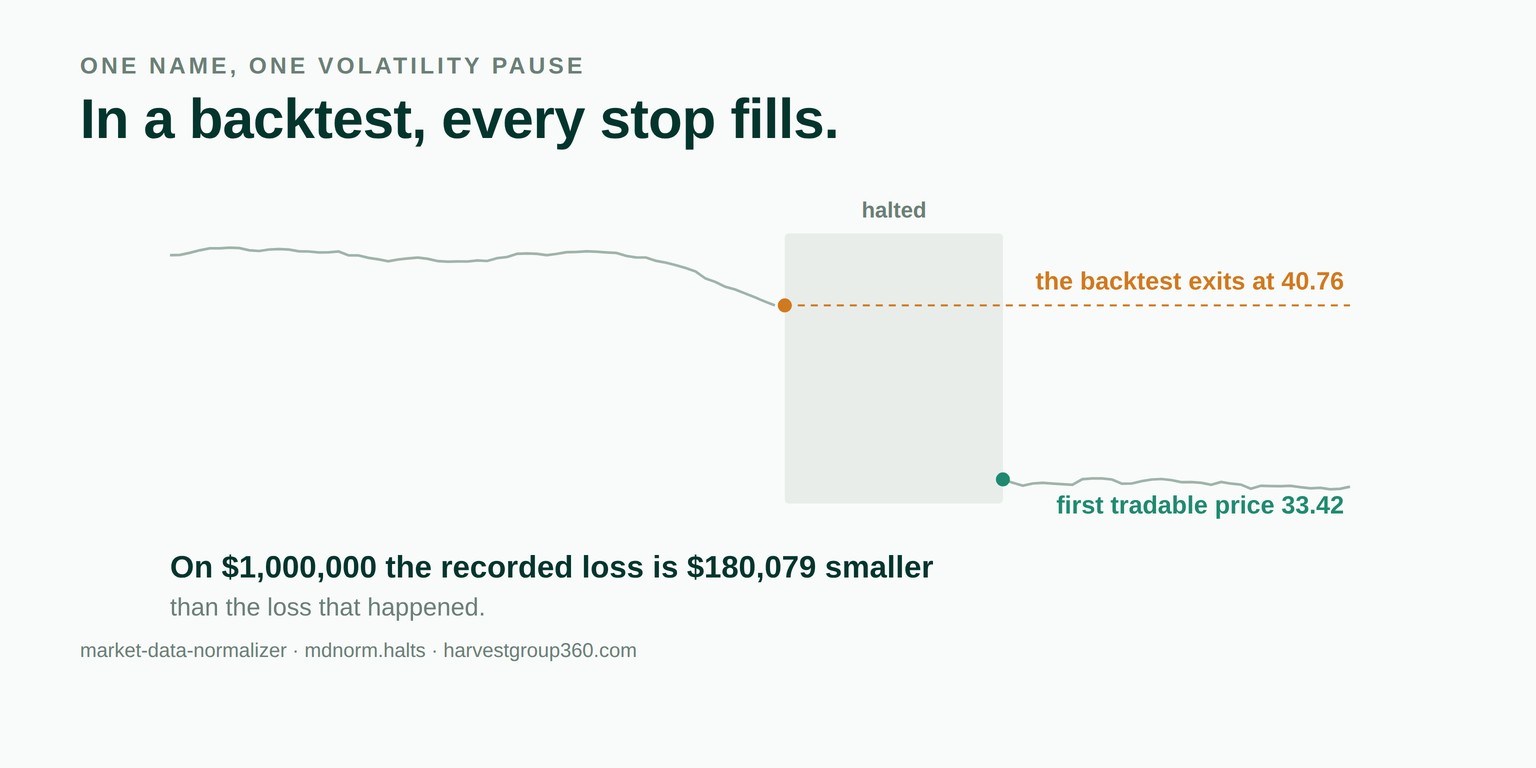
Take one name and one volatility pause. The last print before the halt is 40.76. The instrument stops trading for thirty-two minutes and reopens at 33.42.
A stop-loss placed anywhere in that window fills at 40.76 in the backtest, because 40.76 is the price on every row. The first price at which anybody could actually have sold is 33.42:
| Price | On a $1,000,000 position | |
|---|---|---|
| the backtest's exit | 40.76 | — |
| first tradable price | 33.42 | — |
| difference | −1,800.8 bps | $180,079 |
This is not an exotic scenario. It is what a stop-loss is: an instruction to sell when the price falls far enough. Halts are triggered by prices falling far enough. The rule and the pause are set off by the same event, so a backtested stop meets a halt far more often than chance would suggest, and it meets it having already decided to sell.
The obvious objection is that halts are rare, and the obvious objection is correct. Across five names over twenty-one sessions — 40,800 prints, five halts, 150 minutes in total — the halted share of instrument-time is 0.10%.
Then a risk rule is run over the same period: at each minute, size an adjustment by how far the name has moved over the last fifteen. It is the plainest possible construction, and it is the shape of most volatility-scaled and stop-based systems.
| Lookback | Decisions | Inside a halt | Share of notional | Value / count |
|---|---|---|---|---|
| 5 min | 2,575 | 0.78% | 9.06% | 11.7× |
| 15 min | 11,348 | 0.62% | 6.87% | 11.1× |
| 30 min | 18,014 | 0.80% | 7.56% | 9.4× |
| 60 min | 23,724 | 0.63% | 4.74% | 7.5× |
Seventy decisions out of eleven thousand three hundred and forty-eight fell inside a halt. Those seventy carried $7.17m of $104.4m — 6.87% of everything the rule did all month.
The reason is not subtle once stated. A pause is triggered by a large move; a risk rule sizes by how large the move was. They are two responses to the same event. The overlap is not bad luck, it is the mechanism, which is why the ratio holds at every lookback rather than appearing at one convenient setting.
It is worth separating this from two things it resembles. A slippage model assumes a fill occurred and asks what it cost; applied to an order placed during a halt it makes matters worse, because it attaches a plausible cost to a trade that never could have been. And survivorship bias removes instruments from a sample; this removes moments, which no universe construction catches.
The closest relative in our own library is the gap between rows and observations. Both are cases where a dataset offers more than it holds. There the surplus is information; here it is liquidity.
The feature people ask for first is automatic detection: flag any quiet stretch longer than some threshold as a halt and be done with it. We do not, and the reason is the same one that appears in the auctions module and in the staleness work behind it.
On a liquid large-cap, five minutes without a print is remarkable. On a corporate bond it is a Tuesday. A threshold that separates those two is a property of the instrument, and a statistic computed from a threshold somebody else picked is a statement about that threshold. Change ten minutes to fifteen and the halted share of your sample changes, with nothing anywhere reporting that anything moved.
So the windows are supplied or the report says it has none. In the same spirit, a symbol with no halt record at all is named in the output rather than reported as clean — a symbol that never halted and a symbol whose halt file was never loaded produce identical arithmetic, and only one of them is good news.
One detail is worth stating because it decides a real case. Halt windows here are half-open, like every interval in this library: a print stamped at the instant the pause begins is inside it, and a print stamped at the reopening time is not.
That is the correct reading rather than a convention. The reopening auction is the first thing anybody can trade, so it belongs to the tradable side; the moment the halt is called, the market is already shut. Getting this backwards moves the single most important print of the episode — the reopening cross — into the untradable bucket, and with it the only price that was ever available.
$ mdnorm halts trades.csv --halts halts.csv --decisions fills.csv
events               40800
halts                5 across 5 symbol(s)
halted time          2h30m
longest halt         30m
share of covered     0.10%
reopening moves      (no tradable price existed across these)
  AAA 30m  40.76 -> 33.42  -1800.8 bps
  BBB 30m  42.69 -> 35.01  -1799.0 bps
  CCC 30m  34.65 -> 28.42  -1798.0 bps
decisions            11348
  unfillable         70 (0.62%)
  by value           6.87%
note: the value share exceeds the count share, which means the
decisions taken while halted were the large ones.
The decisions file is the part worth wiring up. It is three columns — a timestamp, a symbol and a value — and the value is whatever you are measuring: notional, position change, realised profit. Nothing interprets it, so the share means whatever the input meant. Without it the command still reports halted time and the reopening moves, but the number that matters needs to know what the strategy was doing.
Every figure above came from the halts module of our open-source library, released in version 1.33.0. MIT licensed, no runtime dependencies, 1,315 tests, type-checked clean.
pip install market-data-normalizerThe source is on GitHub, the package on PyPI, and the reasoning behind what the library will and will not do is in ROADMAP.md beside the code. Longer write-ups are on our Medium, releases on LinkedIn, and the tooling we run against our own data is in the Console.
The rest of the series is in our blog: the biggest trade of the day that was not a trade, a thousand rows and two hundred observations, what AI changed and what it multiplied, a volume profile fitted on the rest of the year and the things we have decided not to build. Public comments on the work are quoted in full with a link to each source on the community page, and the team is on the about page. Newer in the same series: why forty positions is not forty bets and a maximum drawdown is a maximum.
We are open to everyone, from independent developers to funds. If something here is wrong, an issue with a concrete input and a statement of what the right answer would be is the most useful form to send it in — a failing test has always been worth more to us than a paragraph that is correct.
Because nothing in the price data says it should not. A halted instrument stops printing, and a pipeline that carries the last price forward onto a fixed grid produces rows that look exactly like quiet trading. The strategy reads a price, the fill engine accepts it, and no part of that chain has been told the market was shut.
The flattering one, almost always. Halts happen on the day of the news, so a risk rule fires into them — and a stop that fills at the last pre-halt price avoids the entire reopening move. On the worked example, an exit recorded at 40.76 against a first tradable price of 33.42 understates the loss on a million-dollar position by $180,079.
Very little of the time and a great deal of the money. Across five names and twenty-one sessions, five halts accounted for 0.10% of instrument-time and 0.62% of the risk rule's decisions — but 6.87% of its notional, eleven times the count share.
Because both numbers have the same cause. A volatility pause is triggered by a large move, and a risk rule sizes by how far the instrument has moved. The decisions inside the window are the big ones by construction, so counting trades hides an effect that counting money shows.
No. Slippage assumes a fill happened and asks what it cost. This asks whether the fill could have happened at all. A slippage model applied to an order placed during a halt makes the estimate worse, not better, because it produces a plausible cost for a trade that does not exist.
Not safely. The obvious rule — a quiet stretch longer than some threshold is a halt — fires constantly on an illiquid instrument, and the resulting statistic becomes a property of the threshold rather than of the market. Our implementation infers nothing: either the windows are supplied, or the report says it has none.
They are counted and not interpreted. A print stamped inside a pause is usually a late report of an execution that happened before it, occasionally a cross that is permitted to print, and sometimes a vendor with a broken clock. Deciding which requires knowing the venue, so the report names the count and leaves the judgment to whoever has that knowledge.
No. The frozen stretch is real information about what the position could do, which is nothing, and that is exactly what a risk model should see. The split hands back both halves so the continuous population can be used for microstructure work while the full one stays available for exposure.