
HarvestGroup360
© 2026 HarvestGroup360 — a brand operated by AMII LTD.
A strategy that earned 116.92 per cent over ten years left its investor 55.44 under the most ordinary fee contract there is. More than half of the profit went in fees, and the two terms that decided most of it are not in the name of the contract.
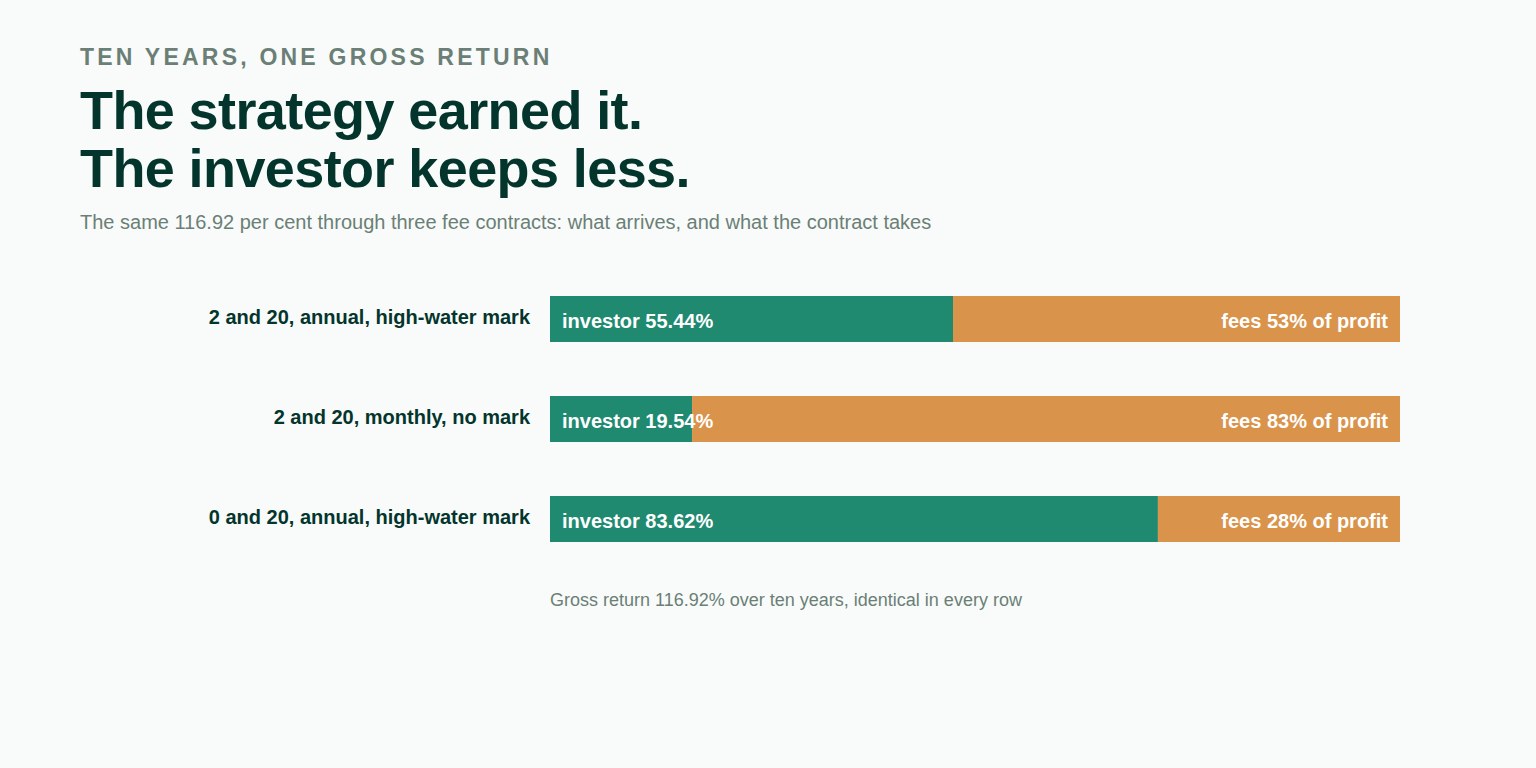
A backtest reports what the strategy earned. An investor is paid what is left after the fund's fees. That gap is usually described in one phrase — two and twenty — and the phrase makes it sound like a constant subtracted from the return. It is not.
A management fee is charged whether or not anything was earned, and it compounds against the investor. An incentive fee takes a share of every gain and gives nothing back when a later period loses. How much that adds up to depends on details that are rarely printed next to the number.
Ten years of monthly gross returns, about 8.05 per cent a year: 116.92 per cent in total. A respectable strategy. The same series taken through eight fee arrangements:
| Contract | Investor keeps | Share of the profit taken |
|---|---|---|
| No fees | 116.92% | 0% |
| 2 and 20, annual, high-water mark | 55.44% | 52.59% |
| 2 and 20, quarterly, high-water mark | 53.19% | 54.51% |
| 2 and 20, monthly, high-water mark | 52.74% | 54.89% |
| 2 and 20, annual, no mark | 53.31% | 54.41% |
| 2 and 20, monthly, no mark | 19.54% | 83.29% |
| 1.5 and 15, annual, high-water mark | 67.98% | 41.86% |
| 2 and 0 | 77.77% | 33.48% |
| 0 and 20, annual, high-water mark | 83.62% | 28.48% |
Look at the last row. No management fee at all, a twenty per cent incentive fee, a high-water mark — and it still took 28.48 per cent of the profit, not twenty.
The reason is asymmetry. The incentive fee is crystallised at the end of each year. A good year pays it. If the next year is bad, nothing comes back; the high-water mark only stops the fund being paid again for recovering the same ground. Over ten years with a mixture of good and bad years, a twenty per cent share of each good year's gain adds up to more than twenty per cent of the ten-year total.
That is why the library reports fee_share_of_profit: one minus net over gross. It is the number to compare between two funds, and it is almost never the number in the fund's name.
“Two and twenty” describes two parameters. The table shows two more doing most of the work.
Crystallised monthly, the incentive fee is taken on every good month and never returned on a bad one. Crystallised annually, the year is netted first. On these returns, with a high-water mark, the difference is modest: 52.59 per cent of the profit annually, 54.89 monthly.
Remove the high-water mark and a fund that falls and then recovers is paid for the recovery. Combine that with monthly crystallisation and the share of profit taken jumps to 83.29 per cent. The investor keeps 19.54 per cent of a strategy that earned 116.92.
Both are real contract terms, which is why the library offers them. Neither is assumed: every field of the fee schedule is required, because a default here would be a claim about somebody else's contract. This is the same argument as the rebalancing frequency one layer up — an unstated schedule deciding how much of the result survives.
On the standard contract the annualised Sharpe ratio goes from 0.67 gross to 0.41 net. The total return more than halves. It looks as though the fee has hurt the ratio less than the return.
It has, and not because the fee is gentle. A Sharpe ratio is built from the average monthly return, and averages do not compound. The fees cut the average month by 39 per cent. Compounded over ten years, a month that is 39 per cent smaller becomes a total that is 53 per cent smaller. The ratio only sees the first number.
Volatility barely moves. Under annual crystallisation it even rises slightly, because the incentive fee arrives in a few large deductions rather than a steady trickle; crystallise monthly and it falls a little instead. Either way it is not what separates the two figures. The library reports both ratios side by side, so a 39 per cent fall in the ratio is not read as a fee that took 39 per cent.
If the sample ends between crystallisations, the accrued incentive fee is charged at the final observation, as if the investor redeemed there. A net figure that ignores it is one nobody could have redeemed at.
An optional hurdle grows the high-water mark period by period, so the incentive fee is only due on gains above it. It has to be supplied as a per-period series; the hurdle article covers turning a quoted rate into one, including the 360-day convention that understates it.
The module is called fundfees, not fees, so it cannot be mistaken for the library's trade-cost model, which prices a transaction rather than a contract.
from mdnorm import FeeSchedule, apply_fees

res = apply_fees(gross, FeeSchedule(
    management=D("0.02"), incentive=D("0.20"),
    periods_per_year=12, crystallise_every=12,
    high_water_mark=True))

res.gross_total            # 1.169200
res.net_total              # 0.554361
res.fee_share_of_profit    # 0.525863
$ mdnorm fees gross.csv --management 0.02 --incentive 0.20 \
--periods-per-year 12 --crystallise-every 12 3 1 --compare-hwmEverything else in this series is about getting a gross number right. This is the last step between a backtest and a statement anyone could invest on. It belongs in a data library for the same reason the rest does: the arithmetic is simple, the conventions are not written down, and every convention that is left implicit errs in the direction that makes the number look better than the investor's statement will.
Every figure above came from the fundfees module of our open-source library, released in version 1.46.0 the same day. The series is a seeded pseudo-random draw — 120 monthly returns built as gauss(0.0095, 0.035) from random.Random(20260921), rounded to ten places — so every figure reproduces exactly on any machine. Every number in this article was recomputed against the package as published on PyPI after the text was written. MIT licensed, no runtime dependencies, 1,790 tests, type-checked clean.
pip install market-data-normalizerThe source is on GitHub, the package on PyPI, and the reasoning behind what the library will and will not do is in ROADMAP.md beside the code. Longer write-ups are on our Medium, releases on LinkedIn, and the tooling we run against our own data is in the Console.
The rest of the series is in our blog: a fat tail and a fat finger look identical, how often the book is traded back, a return has to beat something, the average return nobody received and the things we have decided not to build. Public comments on the work are quoted in full with a link to each source on the community page, and the team is on the about page.
We are open to everyone, from independent developers to funds. If something here is wrong, an issue with a concrete input and a statement of what the right answer would be is the most useful form to send it in — a failing test has always been worth more to us than a paragraph that is correct.
Usually far more than twenty per cent. On the ten-year series in this article, a two per cent management fee and a twenty per cent incentive fee with annual crystallisation and a high-water mark took 52.59 per cent of the profit. The strategy earned 116.92 per cent; the investor kept 55.44.
Because it is charged on gains and never returned on losses. A good year is paid for when it crystallises; a bad year afterwards gives nothing back. Even with no management fee at all, a twenty per cent incentive took 28.48 per cent of the profit on the same series.
It is how often the incentive fee is actually taken. Monthly crystallisation charges every good month and nets nothing against the bad ones; annual crystallisation nets the year first. On identical returns the share of profit taken ran from 52.59 per cent to 83.29 per cent depending on this and on whether there was a high-water mark.
It means a fund is not paid twice for the same gain. Without one, a fund that falls and then recovers is paid an incentive fee on the recovery. With one, the fee is only due on gains above the previous peak.
Because the ratio is built from the average monthly return, and averages do not compound. In the example the fees cut the average month by 39 per cent; compounded over ten years, that became a total 53 per cent smaller. Volatility barely moved. The annualised Sharpe ratio went from 0.67 to 0.41, and a ratio that fell 39 per cent is not a fee that took 39 per cent.
The fundfees module of our open-source library, released in version 1.46.0. The series is a seeded pseudo-random draw stated in the article, so every figure reproduces exactly. MIT licensed, no runtime dependencies, 1,790 tests, type-checked clean.