
HarvestGroup360
© 2026 HarvestGroup360 — a brand operated by AMII LTD.
Rebalancing every day beats never rebalancing by 44 basis points over five years and turns the book over 5.6 times to do it. At 7.89 basis points per turn the advantage is gone. Most backtests report the first number and not the second.
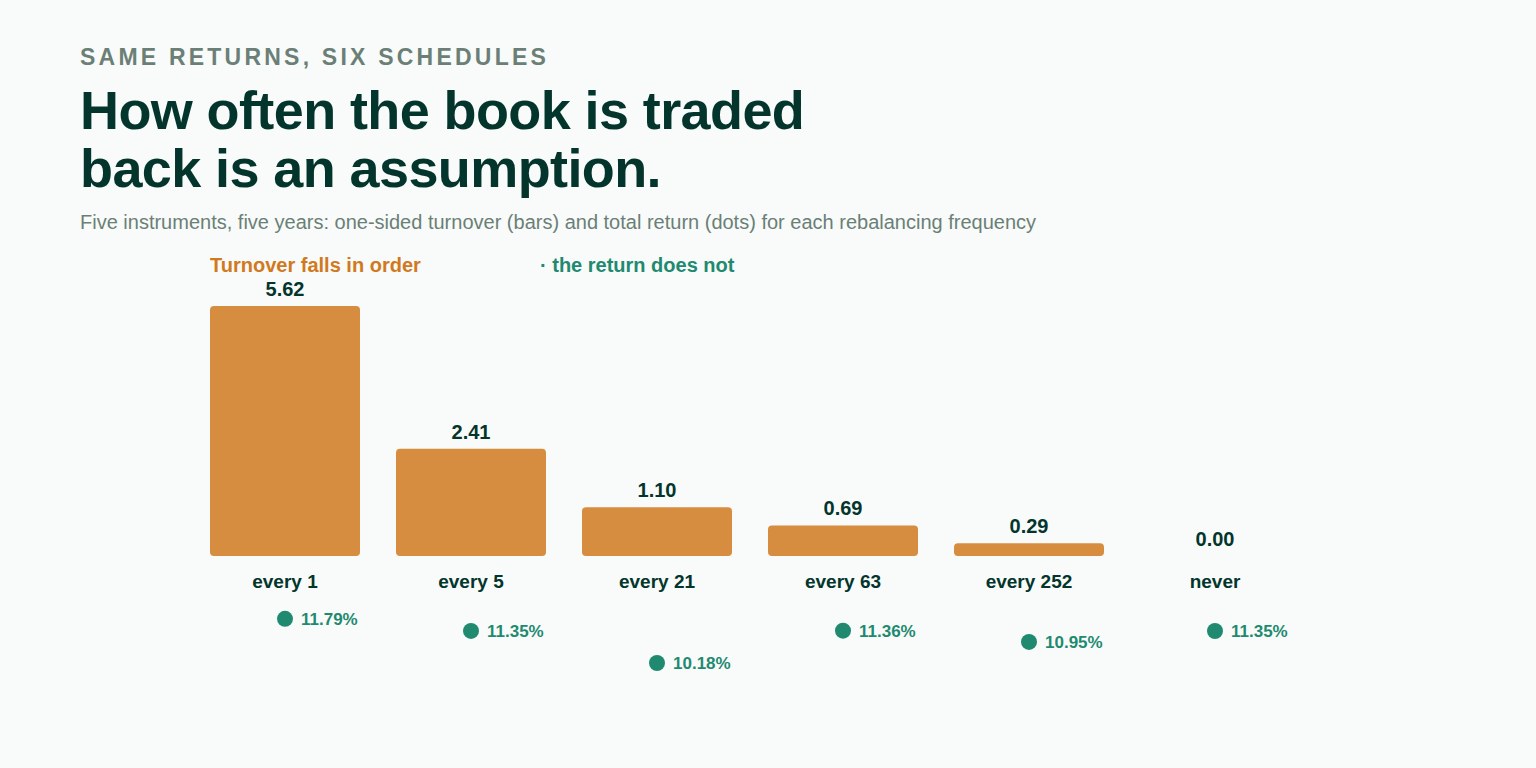
Every evaluation in a backtest reads a return series. Very few of them ask where the series came from. For a portfolio, it came from a set of weights, and a set of weights is a decision made once. What happens to it afterwards is arithmetic: winners grow, losers shrink, and by the end of a month an equal-weight book is not equal-weight any more.
Most backtests handle this by not handling it. The weights are snapped back to target at every observation, which earns a return nobody could have had without trading, and the trading is never reported.
Five instruments, five years of daily returns, equal weight, one name noticeably more volatile than the other four. The returns are identical in every row below. The only thing that changes is how often the book is assumed to be traded back to target:
| Schedule | Total return | One-sided turnover | Rebalances | Worst drift |
|---|---|---|---|---|
| Every period | 11.7901% | 5.6217 | 1,259 | 0.0000 |
| Every 5 periods | 11.3488% | 2.4133 | 251 | 0.0213 |
| Every 21 periods | 10.1833% | 1.0955 | 59 | 0.0376 |
| Every 63 periods | 11.3573% | 0.6863 | 19 | 0.0726 |
| Every 252 periods | 10.9495% | 0.2868 | 4 | 0.1156 |
| Band, 2 percentage points | 10.8574% | 0.9783 | 39 | 0.0199 |
| Never | 11.3466% | 0.0000 | 0 | 0.1523 |
Rebalancing at every observation is the assumption most backtests make without stating it. Here it beats never rebalancing by 44 basis points over five years — and turns the book over 5.6 times to do it.
Divide one by the other and you get the number worth arguing about: 7.89 basis points per unit of one-sided turnover. Charge that for trading and the advantage is exactly gone. Charge more and the untouched book wins. The library reports that level as breakeven_cost_bps, which is not a recommendation. It is the cost at which the argument changes sides, and a reader who knows their own trading costs can place themselves on one side of it.
The sign is kept when it goes the other way. If the more active schedule earned less before any costs, the breakeven is negative, and it is reported as negative rather than as a magnitude, because a small positive-looking number there would read as a bargain.
Look at two rows together. Rebalancing every five periods allowed a worst drift of 0.0213 and needed 2.41 of turnover. A band that trades only when some weight is more than two percentage points from target held the worst drift to 0.0199 and needed 0.98.
Tighter control, less than half the trading. That is what happens when the trigger is the thing you care about rather than the date. Most weeks nothing has drifted far enough to matter, and a calendar rule trades anyway.
The untouched book is the other end of it. Left alone, some weight was more than two percentage points from its target for 97.70 per cent of the five years, and the furthest any weight wandered was 0.1523 — a book still described as equal-weight that had not been equal-weight for most of its life.
There is no default schedule, no default band and no default turnover convention. The frequency is the parameter this work exists to make visible; a library that chose one would be hiding the thing it was built to show.
If a held instrument has no return for a period, the calculation stops and names the period and the instrument. A name that did not trade and a name that was flat produce the same weight and mean different things, and filling the gap with zero would choose one of them silently.
Nothing is costed here. Pricing a trade is a separate question with its own inputs — spreads, impact, participation — and belongs to the library's costs module. A schedule that arrived with a cost model attached would stop that model being something the caller states. The residual weight, if the book is not fully invested, is carried as cash at zero; the hurdle module is where that assumption gets priced.
One-sided and two-sided turnover differ by a factor of two and both are printed under the same word. turnover_between makes the caller name which, and the one-sided version is checked in the test suite against the library's existing turnover calculation on the same weight path.
from mdnorm import periodic_rebalance, buy_and_hold, compare_schedules

cmp = compare_schedules({
    "every 1": periodic_rebalance(target, returns, every=1),
    "never":   buy_and_hold(target, returns),
})

cmp.return_spread        # 0.00443514 — 44 basis points
cmp.breakeven_cost_bps   # 7.8893
$ mdnorm rebalance panel.csv --every 1 21 252 --band 0.02 \
--hold --drift-band 0.02The last few pieces in this series have each been about a number that depends on a choice nobody wrote down. The square root of twelve assumes independence. A maximum drawdown depends on how long you looked. A Sharpe ratio depends on the hurdle under it. A portfolio's return depends on how often it was traded back, and on nothing in the data.
Every figure above came from the rebalance module of our open-source library, released in version 1.45.0 the same day. The returns are a seeded pseudo-random draw — 1,260 periods of five instruments from random.Random(20260919), each gauss(mean, sd) with means from 0.00024 to 0.00055 and standard deviations from 0.0090 to 0.022, rounded to ten places — so every figure reproduces exactly on any machine. The exact parameters are in the test file beside the module. MIT licensed, no runtime dependencies, 1,759 tests, type-checked clean.
pip install market-data-normalizerThe source is on GitHub, the package on PyPI, and the reasoning behind what the library will and will not do is in ROADMAP.md beside the code. Longer write-ups are on our Medium, releases on LinkedIn, and the tooling we run against our own data is in the Console.
The rest of the series is in our blog: a return has to beat something, a maximum drawdown is a maximum, the square root of twelve is an assumption, why forty positions is not forty bets and the things we have decided not to build. Public comments on the work are quoted in full with a link to each source on the community page, and the team is on the about page.
We are open to everyone, from independent developers to funds. If something here is wrong, an issue with a concrete input and a statement of what the right answer would be is the most useful form to send it in — a failing test has always been worth more to us than a paragraph that is correct.
Because between rebalances the weights drift with the returns, and a backtest that snaps them back to target at every observation is trading constantly without saying so. The frequency changes both the return and the trading required to earn it. In the example in this article, five frequencies on identical returns produced total returns between 10.18 and 11.79 per cent.
Not on the evidence here. Rebalancing every period beat never rebalancing by 44 basis points over five years and turned the book 5.6 times to do it. At 7.89 basis points per unit of turnover that advantage is exactly gone, and above it the ranking reverses.
Not one the data will tell you. Turnover rises steadily as the frequency increases; the return does not follow any order. In the example, rebalancing every 63 periods beat every 5, which beat every 252, which beat every 21. The differences in return are noise and the differences in trading are not.
Trading back to target only when some weight has drifted further than a stated limit, rather than on a calendar. In the example a band of two percentage points held the worst drift to 0.0199 with 0.98 units of turnover, while rebalancing every five periods allowed 0.0213 and needed 2.41. A calendar does not know whether anything has moved.
No. It reports how much trading a schedule implies and the cost per unit of turnover at which two schedules swap places. Pricing the trade is a separate module, so the cost model stays something the caller states rather than something a schedule brings with it.
The rebalance module of our open-source library, released in version 1.45.0. The returns are a seeded pseudo-random draw stated in the article, so every figure reproduces exactly. MIT licensed, no runtime dependencies, 1,759 tests, type-checked clean.