
HarvestGroup360
© 2026 HarvestGroup360 — a brand operated by AMII LTD.
Two people asked us, independently, for a native Rust port of our calculation paths. Both assumed the same thing we did: that exact decimal arithmetic in pure Python is the reason it is slow. We wrote the benchmark before writing any Rust, and the assumption turned out to be mostly wrong.
The request was reasonable and specific: put the normalization and the calculators inside a low-latency execution path. We had already written in our public roadmap that we would publish a benchmark first, so the argument could be about measured numbers rather than the general reputations of two languages. This is what that measurement said.
Most published benchmarks are wrong in the same four ways, and all four are avoidable in about ten lines.
Report the minimum, not the mean. This is the one people argue about, and the argument resolves once you notice that noise is one-sided. Another process stealing the CPU can only make your code look slower; nothing can make it look faster than it is. The minimum is therefore the closest estimate of the true cost, and the mean is largely a measurement of your neighbours.
Warm up first. The first call pays for imports, bytecode specialisation and cold caches. Timing it measures the interpreter's startup, not your function.
Turn off the garbage collector during the timed region and turn it back on afterwards. Otherwise a collection triggered by unrelated allocation lands inside a random run and moves the result by more than the change you are trying to measure.
Print the machine. An absolute number without the hardware it came from is not a result. What travels between machines is the ratio between two cases measured on the same one.
| Case | n | per second | each |
|---|---|---|---|
| Normalize CSV rows into events | 50,000 | 258,129 | 3,874 ns |
| Aggregate 1-minute bars | 50,000 | 1,773,239 | 564 ns |
| Align 4 streams onto a grid | 40,000 | 3,076,375 | 325 ns |
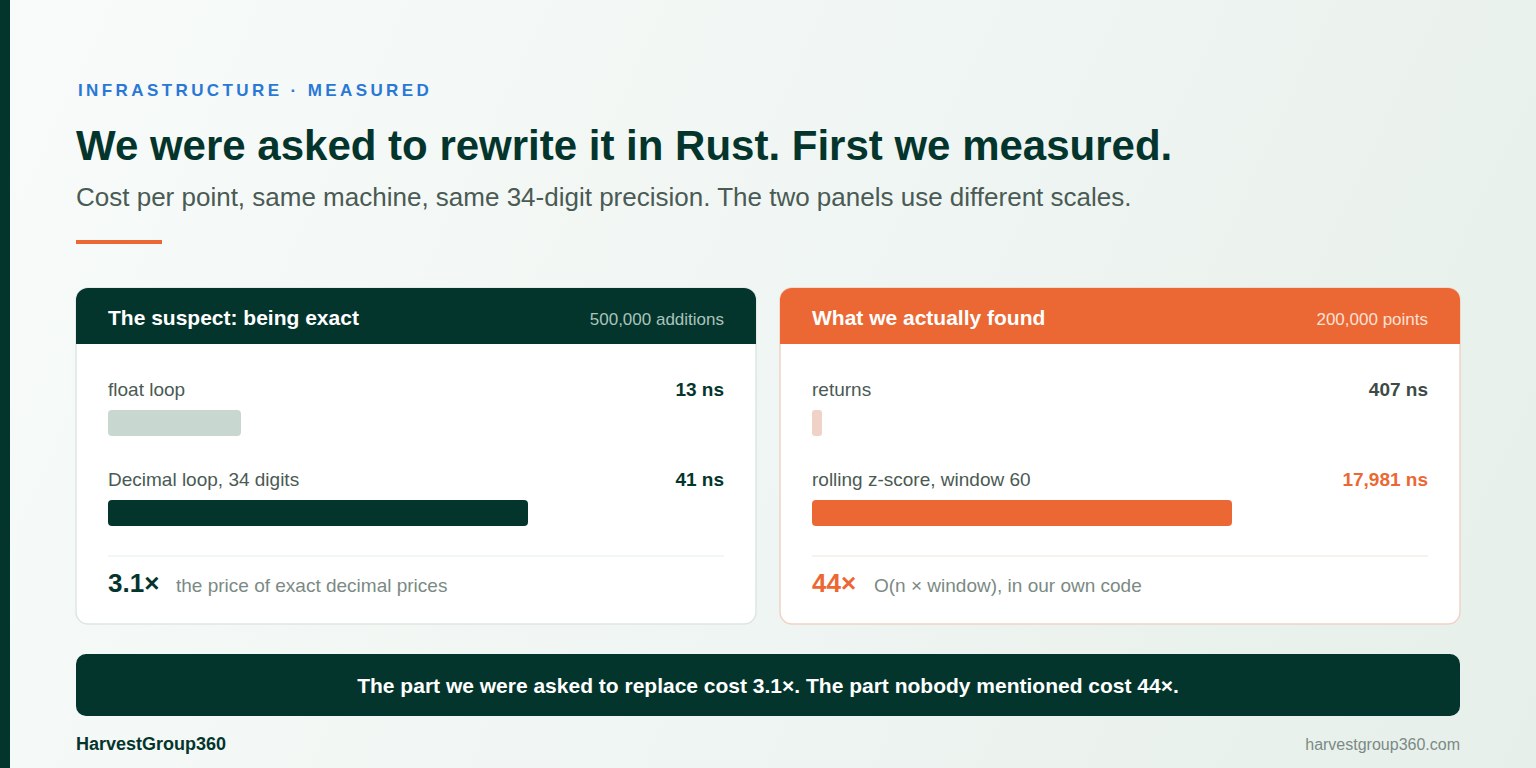
| Returns | 200,000 | 2,457,375 | 407 ns |
| Rolling z-score, window 60 | 200,000 | 55,615 | 17,981 ns |
| Sharpe report | 100,000 | 1,085,889 | 921 ns |
| Resolve ticker to instrument | 200,000 | 4,151,382 | 241 ns |
| Accumulate values, float | 500,000 | 76,750,636 | 13 ns |
Accumulate values, Decimal | 500,000 | 24,634,771 | 41 ns |
Look at the last two rows. Exact decimal arithmetic at 34 digits of precision costs 3.1 times a float loop over identical values. Not fifty times, not a hundred — three.
That is the number the whole Rust question turns on, and it points the other way from the folklore. Decimal in CPython is a C implementation, and for addition and comparison the gap to a native double is small. It widens for division and square roots, which is why a variance costs more than a mean, but it never approaches the order of magnitude people assume when they say a library is slow because it does not use floats.
Everything else in that table already runs at 34-digit precision. So the distance between this library and a fast one is mostly the interpreter and the algorithm — and only a small part of it is the exactness we chose on purpose.
The rolling z-score cost 17,981 nanoseconds per point against 407 for a return on the same series. Forty-four times, for a statistic that is conceptually a mean and a standard deviation.
The reason was not exotic. The trailing statistics were O(n × window): every index summed its own window from scratch, so at window 60 that is sixty additions per point where one would do. On top of it, deciding whether a window contained a gap was a sweep of the whole window at every index, and rolling_zscore computed the window mean twice — once directly, and again inside the standard deviation it called.
We fixed the two cheap ones. The gap check now carries the position of the most recent hole and compares against it once per index. The z-score computes its mean once.
| 200,000 points, window 60 | before | after | |
|---|---|---|---|
| Rolling mean | 789 ms | 515 ms | 1.53× |
| Rolling z-score | 4,543 ms | 3,527 ms | 1.29× |
| Rolling standard deviation | 3,639 ms | 3,385 ms | 1.08× |
An optimisation to a numerical library is only worth having if the numbers are unchanged, and the test suite is not sufficient evidence of that — a suite passes on the values it thought to check.
So we ran the old implementation and the new one side by side across 144 combinations of series length, gap density, window size and degrees of freedom, and compared the string form of every value rather than equality. That distinction matters: in decimal arithmetic Decimal('2.50') and Decimal('2.5') compare equal while carrying different exponents, and an optimisation that changed the scale of a result would sail through an equality check. Every value matched, exponent included.
There is an obvious next step. Keep a running total: add the value entering the window, subtract the one leaving it, and the whole thing becomes O(n). (We refused it here and reversed that refusal in v1.24.0, once it turned out the objection below was testable.) It would be several times faster than anything above.
We are not doing it, and the reason is the reason this library exists.
Decimal addition rounds to the working precision. A running total therefore accumulates a different rounding history than a fresh sum over the same window — and the two disagree in the last digits by an amount that depends on how far into the series the window happens to sit. The same window of the same values would give a slightly different standard deviation depending on whether it appeared early in the file or late.
A library whose central claim is exact, reproducible numbers cannot have a statistic that quietly depends on position. The 1.08× on the standard deviation is what that costs, and it is written down in the benchmark rather than left as a surprise. If your work genuinely needs the running-sum version, it is a few lines in your own code and you now know exactly what you are trading.
None of this argues that a faster language is never warranted. It argues for an order of operations.
Fix the algorithm first, because an O(n × window) loop is just as slow in Rust — you would have rewritten the same mistake in a language where it is harder to change. Then profile, and see whether what remains is the interpreter or the arithmetic; our benchmark says that for this library it is mostly the interpreter, which is exactly the part a compiled language buys back. Then ask whether the workload needs it at all: a research pipeline that runs overnight and an execution path with a microsecond budget are different problems, and only one of them is worth maintaining two implementations for.
That last point is the one we keep coming back to. Two implementations have to agree, and the guarantees that make this library worth using are behavioural — a join that only searches backwards, a window that emits nothing until it has filled, a guard that reports what it removed. A fast version that disagrees with the slow one about where a fold boundary falls is worse than having no fast version at all. That is not an argument against the port; it is a statement of what the port would have to include, and it is most of the work.
Nobody should be calling a rolling z-score between a quote and an order. If that is your problem, the number that matters to you is not in our table, and we would rather see your latency budget than guess at it. The related discipline on where delay actually comes from is in the true cost of latency.
$ git clone https://github.com/Harvestgroup360/market-data-normalizer
$ cd market-data-normalizer
$ python bench/benchmark.py

$ python bench/benchmark.py --scale 4 --json results.json
Standard library only, no arguments required. The full results and methodology are in BENCHMARKS.md, and the library itself is on GitHub and installable from PyPI. What we intend to build next and what we have decided against is in the roadmap; what people have said about the work, with a link to each original, is on our community page.
If your numbers disagree with ours, those numbers are the interesting part. We would rather have them than a discussion about which language is faster in general.
Less than its reputation suggests. Accumulating 500,000 values at 34-digit precision took 41 nanoseconds each against 13 for the identical float loop — a factor of 3.1, not the one or two orders of magnitude usually assumed. Decimal is implemented in C in CPython, and for addition and comparison the gap is small. It widens for division and square roots, which is why a variance costs more than a mean.
Take the minimum of several runs rather than the mean, because noise on a shared machine only ever adds time and a mean mostly measures the neighbours. Warm the code first so you are not timing the import and the first-call bytecode. Disable the garbage collector during the measurement and re-enable it after. Print the machine alongside the figures — absolute numbers without a machine are not a result, and the ratios are the part that travels.
That every point recomputes its window from scratch. A trailing mean over sixty observations does sixty additions per point instead of one, so the cost scales with both the length of the series and the size of the window. In our benchmark a rolling z-score at window 60 cost 44 times a simple return on the same series, which is the shape you would expect from a factor of sixty partly offset by cheaper arithmetic.
Because it changes the answer. Decimal addition rounds to the working precision, so a running total carries a different rounding history than a fresh sum over the same window, and the two disagree in the last digits by an amount that depends on how far into the series you are. For a library whose central claim is exact, reproducible numbers, a statistic that quietly depends on where the window sits is not an acceptable trade.
After the algorithm is right and the profile says the interpreter is the remaining cost, and when the workload actually needs it — an execution path with a latency budget, not a research pipeline that runs overnight. A rewrite is a permanent commitment to maintaining two implementations that must agree, and two implementations that disagree about where a fold boundary falls are worse than one slow one.
By comparing against the previous implementation directly, not by trusting the test suite. We ran both versions across 144 combinations of series length, gap density, window and degrees of freedom, and compared the string form of every Decimal rather than just equality — so a value that was numerically equal but differently scaled would still have failed. Equality alone would have hidden a change in exponent.
For prices, yes. A price is a decimal quantity by definition — venues quote in ticks, not in binary fractions — and float cannot represent most of them exactly. The errors are individually tiny and they accumulate through aggregation, so a figure that should be reproducible becomes dependent on the order the rows were summed. That is a poor property for anything you intend to audit.
It is a script in the public repository, uses the standard library only, and needs no arguments to run. The published results state the machine they came from, and a scale flag lets you make the inputs larger. If your numbers disagree with ours, those numbers are the interesting part and we would rather see them than argue from reputation.